当前位置:网站首页>(3) Introduction to bioinformatics of R language - function, data Frame, simple DNA reading and analysis
(3) Introduction to bioinformatics of R language - function, data Frame, simple DNA reading and analysis
2022-07-06 12:20:00 【EricFrenzy】
notes : This blog aims to share personal learning experience , Please forgive me for any irregularities !
Catalog
Function function
Like other programming languages ,R Language also has built-in functions ( As previously used c()) And custom functions . Functions generally consist of three important parts : Input parameters , Function main body , Returns the parameter .R Language functions also allow no input parameters or return parameters . The following example is in R Construct and call functions in language :
# use R Language built in function() Function to declare a function , And declare the input parameters in parentheses . It can be used = Set default values for parameters
#getDouble The name of the function constructed for
getDouble <- function(num=1){

  result <- num * 2 # Function main body
  return(result) # For return parameters return()
}

myResult <- getDouble(num=20) # Call function ,myResult Should be 40
return() and print() The difference is that it is different from print() Will be in Console Display output instead of return() Can't .
data.frame Data frame
Compared with list,data.frame In Computational Biology R Language is more widely used . It's like matrix equally ,data.frame It is also a two-dimensional data structure , That is, it consists of rows and columns . However ,matrix All elements of are like vector The same must be the same data type , but data.frame Just ensure that the data type of each column is the same . This makes data.frame It can be easily used to read something like .csv or .xlsx Such a table file may have multiple data types .data.frame See the following example for the structure of :
id <- c("ENO2", "TDH3", "RPL39", "GAL4") # The code of protein

protName <- c("enolase", "glyceraldehyde-3-phosphate dehydrogenase", "60S ribosomal protein L39", "regulatory protein Gal4") # The full name of protein

abundance <- c(24563, 22369, 16232, 32.3) # Content in cells , Company ppm

length <- c(437, 332, 51, 881) # The amount of amino acids in protein

yeastProt <- data.frame(id, protName, abundance, length, stringsAsFactors = FALSE)
# structure data.frame; Every input vector The length should be the same
#vector The variable name of will become the header ,vector The value of will be filled in by column data.frame
The construction is complete data.frame It should be as shown in the figure below : data.frame Index access and matrix similar , See the following example for details :
yeastProt[,1] # Output No 1 The entire contents of the column
yeastProt[2, ] # Output No 2 The whole line , Including the header
yeastProt[1, 2] # Output No 1 Xing di 2 The elements of the column ,enolase
yeastProt[1:3, c(1, 3)] # Output No 1-3 Xing di 1 and 3 Elements , Including the header
yeastProt$length[1:2] # The output column title is length Of the 1 And the 2 Elements ,437 332
yeastProt[1, "abundance"] # Output No 1 The column title is abundance The elements of ,24563
yeastProt[yeastProt[, 4] > 500, 1] # Output yeastProt The first 4 Column greater than 500 Of the lines 1 Column elements ,GAL4
The following table is vector, matrix, data.frame Cross conversion :
| vector To | matrix To | data.frame To | |
|---|---|---|---|
| vector | \ | as.vector() | |
| matrix | as.matrix() | \ | as.matrix() |
| data.frame | as.data.frame() | as.data.frame() | \ |
Converting other data types into data.frame when , The header may be incorrect . Please refer to the following example for modifying the header :
myMatrix <- matrix(data=1:12, ncol=3, nrow=4) #3x4 Of matrix
myDF <- as.data.frame(myMatrix) # To data.frame
# After conversion, the default column title is V1, V2, V3...  The default row title is 1,2,3...
colnames(myDF) <- c("c1", "c2", "c3") # Custom column headings
rownames(myDF) <- c("r1", "r2", "r3", "r4") # Custom row Title
After setting up ,matrix It is transformed into the following figure data.frame: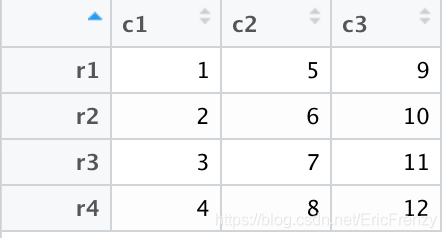
DNA Sequence reading and analysis examples
.fasta File is a common file format generated by reading nucleic acid or protein sequences . There are some explanatory information at the beginning of the document , Such as source species and chromosome numbers ; Next is nucleic acid represented by a single letter / The sequence produced by protein coding . Please start from this link Download the use NC_045512.2 edition COVID19 Of DNA Sequencing data , Extraction code : vfti.
Please see the following example R Language analysis of this sequence :
install.packages('seqinr', repos='http://cran.us.r-project.org') # Install third party libraries
library("seqinr") # Load third party Library
covid <- read.fasta(file="covid19.fasta") # Read .fasta file , Note that the path is best written completely . Read yes list Format
covid_seq <- covid[[1]] # Store the complete sequence as a single vector
DNA from 4 Kind of base form :A、T、C、G.A and T pairing ,C and G pairing . According to chagfu's law (Chargaff’s law) It can be deduced that ,DNA in A and T Same number of ,C and G Same number of . because C and G After pairing, it is linked by three hydrogen bonds ,CG The combination is not easy to be broken up , That is to say DNA The height of CG The content will reduce the possibility of its variation .
Calculation CG The content is shown in the following example :
countTable <- table(covid_seq) # Count each one base Number of occurrences
cgCount <- countTable[["c"]]+countTable[["g"]] #C and G The number of
totalCount <- length(covid_seq) # Total length of the sequence
cgContent <- cgCount/totalCount #CG Proportion in the sequence
Another important concept is DNA word, That is, the length is greater than 1 individual base Of DNA Combine . Through analysis DNA word Whether it is overexpressed or underexpressed , To a certain extent, we can infer the evolution trajectory of this species . ρ ρ ρ Used to express a DNA word Whether it is overexpressed or underexpressed . For a length of 2 Of DNA word, The calculation formula is as follows :
ρ ( x y ) = f x y f x ⋅ f y ρ(xy) = \frac{f_{xy}}{f_{x}·f_{y}} ρ(xy)=fx⋅fyfxy
among f x y f_{xy} fxy yes DNA word Divided by the total length of the sequence , f x f_{x} fx and f y f_{y} fy It's a single base Divided by the total length of the sequence . Calculate sth DNA word See the following example for how to express :
baseCount <- count(covid_seq, 1) # use seqinr In this third-party library count() The length of the function is 1 Of base Number of occurrences of , and R Built in table() similar
wordCount <- count(covid_seq, 2) # Find a length of 2 Of DNA word Number of occurrences of
totalLength <- length(covid_seq) # Total sequence length

# such as , We are looking for TT This DNA word Number of occurrences of
rouTT <- (wordCount[["tt"]]/totalLength)/((baseCount[["t"]]/totalLength)*(baseCount[["t"]]/totalLength))
When ρ ρ ρ be equal to 1 when , This DNA word For completely random , With a single base The product of probability of occurrence is the same . However , When ρ ρ ρ Greater than 1 when , Its probability of occurrence is greater than that of random occurrence , It means that it is over expressed , So we can infer this DNA word It may have some beneficial effects on the evolution of this species . vice versa .
Conclusion
Next time, we will take the data of molecular biology and ecology as an example , Introduce R Matrix diagram in language 、 bar chart 、 The pie chart 、 Dot matrix and linear regression 、 How to use the strip chart , Coming soon ! If you have any questions or ideas, please leave messages and comments !
边栏推荐
- ESP学习问题记录
- Stm32f1+bc20+mqtt+freertos system is connected to Alibaba cloud to transmit temperature and humidity and control LED lights
- Navigator object (determine browser type)
- Feature of sklearn_ extraction. text. CountVectorizer / TfidVectorizer
- Kconfig Kbuild
- arduino获取数组的长度
- Comparaison des solutions pour la plate - forme mobile Qualcomm & MTK & Kirin USB 3.0
- Detailed explanation of truncate usage
- Basic operations of databases and tables ----- view data tables
- Postman 中级使用教程【环境变量、测试脚本、断言、接口文档等】
猜你喜欢
Whistle+switchyomega configure web proxy

JS Title: input array, exchange the largest with the first element, exchange the smallest with the last element, and output array.
Comparison of solutions of Qualcomm & MTK & Kirin mobile platform USB3.0

Arm pc=pc+8 is the most understandable explanation
level16
Single chip Bluetooth wireless burning
arduino JSON数据信息解析
Arduino uno R3 register writing method (1) -- pin level state change
Types de variables JS et transformations de type communes
Feature of sklearn_ extraction. text. CountVectorizer / TfidVectorizer
随机推荐
(一)R语言入门指南——数据分析的第一步
Detailed explanation of 5g working principle (explanation & illustration)
NRF24L01故障排查
Générateur d'identification distribué basé sur redis
Cannot change version of project facet Dynamic Web Module to 2.3.
There are three iPhone se 2022 models in the Eurasian Economic Commission database
Classification, understanding and application of common methods of JS array
Single chip Bluetooth wireless burning
数据库课程设计:高校教务管理系统(含代码)
Rough analysis of map file
Common DOS commands
【ESP32学习-2】esp32地址映射
Basic operations of databases and tables ----- creating data tables
2022.2.12 resumption
Mp3mini playback module Arduino < dfrobotdfplayermini H> function explanation
Basic operations of databases and tables ----- modifying data tables
Postman 中级使用教程【环境变量、测试脚本、断言、接口文档等】
. elf . map . list . Hex file
Arduino get random number
ESP8266连接onenet(旧版MQTT方式)