当前位置:网站首页>The AI method put forward by China has more and more influence. Tianda et al. Mined the development law of AI from a large number of literatures
The AI method put forward by China has more and more influence. Tianda et al. Mined the development law of AI from a large number of literatures
2020-11-06 20:07:00 【Gu Yansheng】
How to excavate the law from the academic literature , Even the research methods of tracing the source of literature ? From Tianjin University 、 Researchers at Zhijiang laboratory and Institute of automation, Chinese Academy of Sciences draw lessons from the idea of molecular marker tracing in the field of biochemistry , The information reflecting the research process in the main body of the literature is traced , More valuable information such as the evolution law of the method is mined out .
It is of great significance to dig out the laws contained in academic documents . Draw lessons from the idea of molecular marker tracing in the field of biochemistry , This article will AI The method in the literature 、 Data sets and indicators are named entities with the same granularity as AI Mark , The information reflecting the research process in the main body of the literature is traced , And then for the literature mining analysis to open up a new perspective , And mining more valuable academic information .
First , This paper uses entity extraction model to extract large scale AI In the literature AI Mark . secondly , Traceability works AI Mark the corresponding original document , Statistical analysis and dissemination analysis based on traceability results . Last , utilize AI The co-occurrence relationship of markers realizes clustering , Get method cluster and research scene cluster , And mining the evolution law within the method cluster and the influence relationship between different research scene clusters .
The above is based on AI Tag mining can make a lot of meaningful discoveries . for example , Over time , Effective methods are spreading faster and faster across different datasets ; The effective methods proposed by China in recent years are becoming more and more influential in other countries , France, on the other hand ; Saliency detection, a classical computer vision research scene, is the least susceptible to other research scenarios .
1 Introduce & Related work
The exploration of academic literature can help researchers quickly and accurately understand the development status and development trend of the field . At present, most of the literature research relies heavily on the metadata of the paper , Including author 、 key word 、 Quote, etc .Sahu Through the analysis of the number of authors, we explore the impact of the number of authors on the quality of literature [19].Wang By counting the number of citations , Release AI The list of highly cited scholars in the field .Yan Et al. Used citation numbers to estimate future references [26].Li We use the knowledge map derived from literature metadata to compare the entity similarity in embedded space ( The paper 、 Authors and journals )[12].Tang Based on key words and authors' country studies AI Trends in the field [27]. Besides , And a lot more based on the author 、 key word 、 Citation, etc. to analyze the literature [4, 13, 14, 20, 24].
Due to the limited semantic content involved in metadata , Some scholars analyze the abstracts of the literature . Abstract is a high summary of the content of the literature , Topic model is the main analysis tool [5, 6, 18, 21, 22, 31].Iqbal Used by others Latent Dirichlet Allocation (LDA) To explore COMST and TON An important theme in [8].Tang Used by others Author-Conference-Topic Model building academic social networks [23]. Besides ,Tang And others found that the current hot research topic TOP10 by Neural Network、Convolutional Neural Network、Machine Learning etc. . however , Topic analysis based on topic model has the problem of inconsistent topic granularity . for example Tang The current hot research topics discovered by et al top10 Inside ,Neural Network、Convolutional Neural Network、Machine Learning The granularity of the three topics is totally inconsistent .
The main content of the abstract is conclusive information , Lack of information reflecting the research process . The main body of the document contains the specific process of the study , But at present, there is no research on the main body of the literature . One of the main reasons is , The body of a paper usually contains thousands of words . On a text that is much longer than the length of the abstract , Using the existing topic model technology to analyze , Non topic words that may lead to low relevance to the topic in the text will also be used as subject words .
We noticed that , Molecular markers are commonly used in the biological field to track changes in substances and cells during reactions , So as to obtain the reaction characteristics and rules [29, 30]. Inspired by this , We find that in the process of mining the characteristics and laws of literature , Method 、 Data sets 、 Indicators can play the same role as molecular markers . We will AI In the literature, these three named entities with the same granularity are used as AI Mark , utilize AI Markers are used to trace the information in the text that reflects the research process . chart 1 It describes AI Similarity and molecular markers . be based on AI Tag mining complements the conventional metadata based and digest based mining .
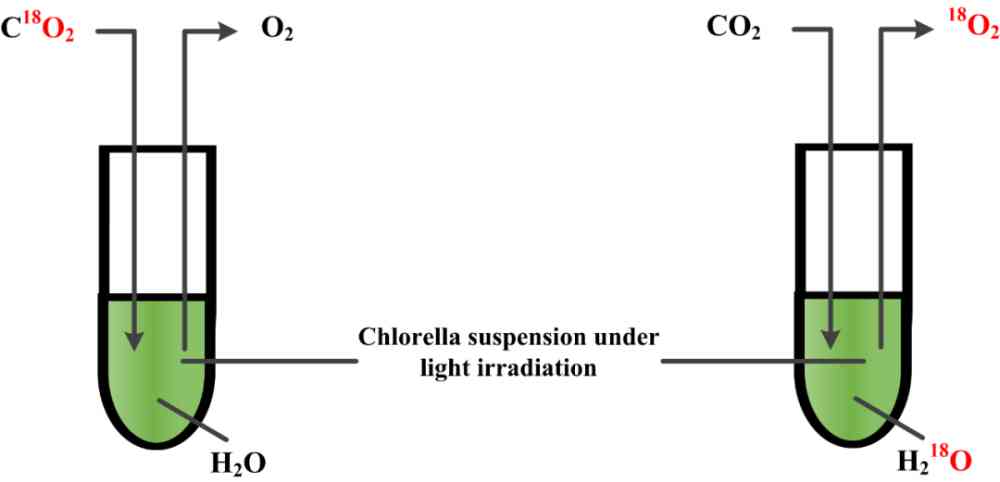
(a) Samuel Ruben and Martin Kamen Using oxygen isotopes 18O Mark separately H2O and CO2, Tracking photosynthesis O2 The source of the .
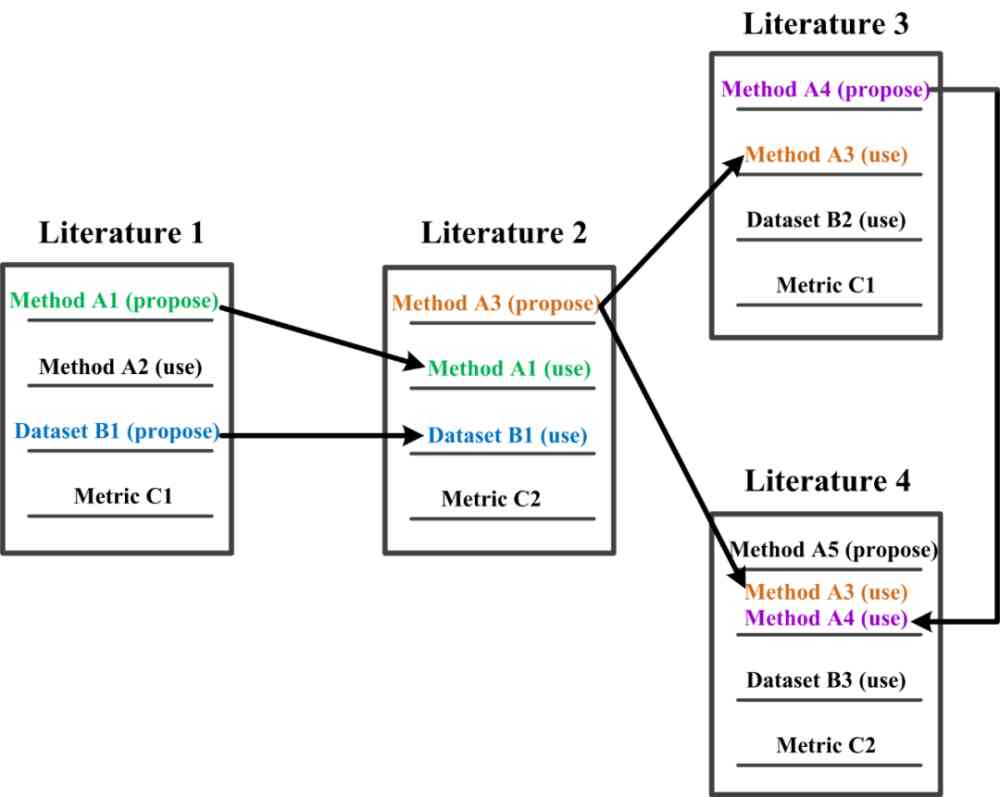
(b) When AI When a marker is proposed or cited in other literature , It's a trace of a particular research process . therefore ,AI Markers can play the same role as molecular markers in mining the characteristics and regularity of literature .
Figure 1:AI Marker and molecular marker analogies
In our research , First of all, we use entity extraction model for large-scale AI In the literature AI Tag to extract , And it works for AI Mark ( Methods and datasets ) Conduct statistical analysis . secondly , We trace the source of the original literature for the effective method and data set extraction , Statistical analysis of the original literature , And it studies the spread of effective methods on data sets and between countries . Last , According to the co-occurrence relationship of methods and research scenarios, the clustering of methods and research scenarios is realized , Get method cluster and research scene cluster . Based on the method cluster and associated data set, the path map is drawn , Study the evolutionary relationship of similar methods , Based on the research scene cluster, this paper analyzes the influence of the method on the research scene and the relationship between the research scenarios .
Based on AI Of the tag AI Literature mining , We can get the following main findings and conclusions :
We take a new perspective on effective methods and datasets , Through to AI Tag for statistical analysis , Got a response AI Important information on the annual development of the field . for example ,2017 The classic data set in the field of unmanned driving KITTI Join in top10 Data sets , It means that driverless is 2017 Hot research topics in ;
In the face of AI Mark the level of statistical analysis of the original literature obtained by traceability , We found that Singapore 、 Israel 、 The number of effective methods proposed by Switzerland is relatively large ; From the perspective of the application of effective methods on data sets , Over time , More and more efficient methods are applied to different datasets ; From the spread of effective methods among countries , China's effective methods are becoming more and more influential in other countries , France, on the other hand ;
Based on method cluster and dataset information , We built a method path map , It can show the time history and data set application of each method in the same method cluster ; For scene clusters , We find that the classical computer vision research scene related to saliency detection is the least affected by other research scenarios .
2 data
In our research process of literature mining , A lot of literature data is needed , therefore , This section first introduces the literature data we collected . Besides , In the course of research , We need to use two machine learning models . therefore , The training data of these two models are also introduced in this section .
2.1 Collected literature data
We use the Chinese computer society (CCF) Grade (Tier-A、Tier-B and Tier-C) Medium AI Journals and conference lists , Collected 2005 - 2019 Published in 2002 122,446 Papers . use GROBID take PDF The format of the paper is converted to XML Format , from XML Title Extraction from format paper 、 Country 、 Institutions and references . For easy reading , We call the collected data CCF corpus.
2.2 Chapter classification training data
Usually , A piece of AI The main body of the document includes an introduction 、 Methods to introduce 、 Experiment chapter 、 Conclusion four parts . In this paper, we use Chapter classification strategy to AI The main body of the literature is classified according to the above four parts .
We randomly choose 2000 piece CCF corpus The literature in , And recruit 10 name AI Field graduate students annotate this 2000 In this paper 63110 Paragraphs . We call this data TCCdata.TCCdata Used to construct the chapter classification BiLSTM classifier [3].TCCdata The number of chapters in each category and the number of paragraphs in each category are shown in the table 1 Shown .
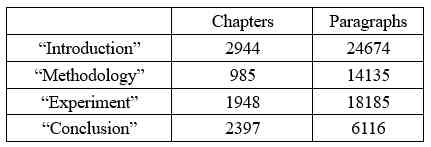
Table 1:TCCdata Number of chapters and paragraphs in
2.3 AI Label extracted training data
For training AI Tag extraction model , We randomly choose 1000 piece CCF corpus The literature in . The contents of the method chapter and the experimental chapter in the main body of the literature are divided into sentences according to punctuation marks , And recruit 10 name AI Field graduate students annotate these sentences . We use BIO Annotation strategy annotation method 、 Data sets 、 Indicators of these three entities , Using the heart of the machine to compile good methods 、 Data sets 、 Indicators are used as reference for labeling . At last we get 10410 A sentence , be called TMEdata.
In the build AI When marking the extraction model , We will TMEdata according to 7.5:1.5:1 The proportion of the training set is divided into training sets 、 Validation set and test set . Training set 、 There are three types of verification set and test set AI The number of marks is shown in the table 2 Shown .
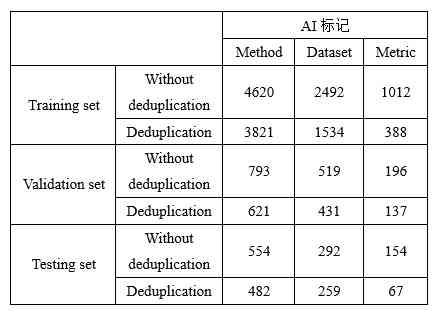
Table 2:TMEdata in AI The number of marks
3 Method
This section describes the specific methods involved in this study , Including chapter classification 、AI Mark extraction and normalization 、AI Mark the source of the original documents 、 Methods and clustering of research scenarios 、 Methods the path map within the cluster was generated and the influence degree of scene cluster was studied .
3.1 Chapter classification
In an article AI In the text of the document , In the methods and experiments sections AI Markers play a substantial role in this paper , So we're only interested in AI Methods and experiments in the main body of the literature AI Tag to extract . however , because AI The diversity of the text structure of literature , It is difficult to use simple rules and strategies to deal with AI The main body of the literature is classified more accurately . therefore , This paper proposes BiLSTM Chapter classification strategy based on combination of classifier and rule .
3.1.1 The proposed classification strategy
The overall process of chapter classification is shown in the figure 2 Shown . For an article AI The main body of the document , We first use rules to match ( Key words and order ) Mark the text chapter . For the matched chapters , Then the chapter label is output . For unmatched chapters , Then enter the paragraph under the chapter to the based on TCCdata Trained paragraph-level BiLSTM The classifier makes predictions . Next, vote on the predicted results of the paragraphs under the same chapter title , Take the most frequent tags as the chapter category . Last , The chapter tags obtained by rule matching are combined with the chapter labels obtained from voting , Get chapter tags for the whole text .
We took the conventional one layer BiLSTM framework . The maximum sentence length is selected as 200, The dimension of word vector is selected as 200,hidden Dimension selection is 256,batchsize Choose 64. Cross entropy is used as the loss function ,TCCdata As training data .
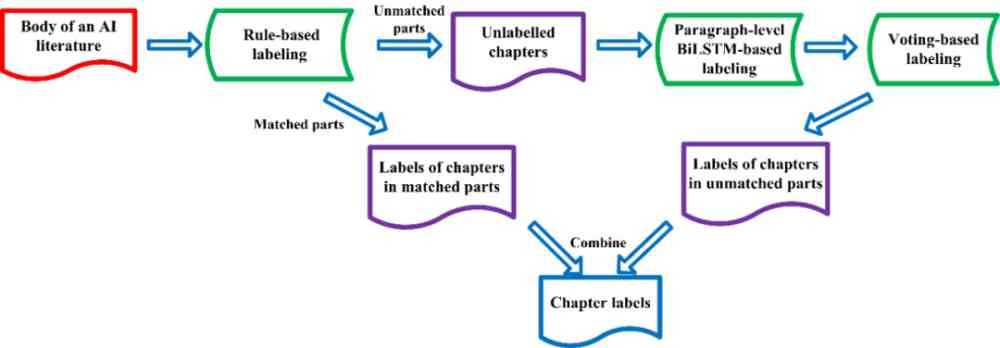
Figure 2: Chapter classification overall process
3.1.2 Evaluate the results
We will TCCdata With 8:1:1 The proportion of the training set is divided into training sets 、 Verification set 、 Test set . On the test set , We match rules 、paragraph-level BiLSTM、 Rules match with paragraph-level BiLSTM Combined with these three kinds of chapter classification methods, we evaluate them respectively . It turns out that , Using only rules to match , Accuracy rate is 0.793. Use only based on TCCdata Trained paragraph-level BiLSTM, Accuracy rate is 0.792. Match rules with based on TCCdata Trained paragraph-level BiLSTM After combining , The accuracy is up to 0.928.
3.2 AI Mark extraction and normalization
AI The extraction and normalization of tags have great challenges . Because a lot of AI The literature , new AI The number of markers is increasing , There are also various forms , Some common words may also be used as data sets . for example DROP stay 2019 Published in [2] Is treated as a dataset .AI There is no specific specification for the naming of tags . Besides , some AI There is ambiguity in the mark . for example CNN, It can express Cable News Network Data sets , It can also mean Convolutional Neural Networks Method . such as LDA, It can express Latent Dirichlet Allocation Method , It can also mean Linear Discriminant Analysis Method .
3.2.1 AI Tag extraction model
AI Tag extraction is a typical named entity recognition problem . Adopted in this paper AI Label extraction model is based on the current classic CNN+BiLSTM+CRF frame [15], And made a small improvement , Pictured 3 Shown .

Figure 3:AI Tag extraction model structure
For an input sentence , among w_i It means the first one i Word . First cut each word into character level , adopt CNN The network gets the... Of each word character-level embedding. And then pass by Glove embedding[17] The module gets the... Of each word word-level embedding. Put the... Of each word in the sentence character-level embedding With each word of word-level embedding Splicing , Then send it to Bi-LSTM. Use self-attention[25] Calculate the association between each word and all other words . Last , Will pass through self-attention The obtained hidden vector is sent to CRF[10], Get the tag sequence of each word y.y∈, The corresponding methods are as follows 、 Data sets 、 Indicators and others .
3.2.2 Experimental setup
The model parameters are set as follows . The maximum sentence length is 100, The maximum word length is selected as 50,batchsize Choose 16. Character level CNN Internet use 5 Juxtaposition 3D Convolution - Activate - Maximum pooling ,5 In sub convolution, we use 10 individual 1*1*50,1*2*50,1*3*50,1*4*50,1*5*50 Of 3 Convolution kernel , Activation functions use ReLU. The final will be 5 The results obtained are stitched together , Get every word 50 Dimension character level word vector .Bi-LSTM Choose a layer ,hidden Select the dimension as 200,self-attention Of hidden Select the dimension as 400.
3.2.3 Evaluate the results
The original samples and their corresponding lowercase samples are used to train the model . At testing time , We test the samples separately (1040 A sentence ) And the corresponding 1040 A sample of lowercase is tested .AI The evaluation results of the tag extraction model are shown in the table 3 Shown .
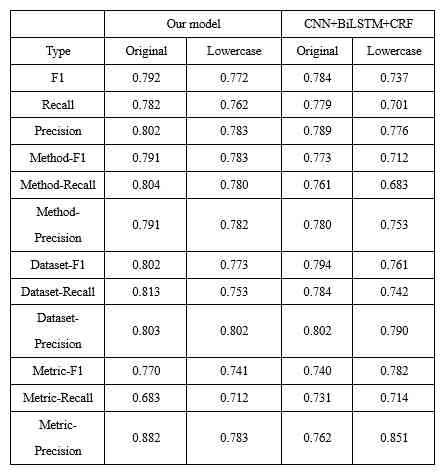
Table 3:AI Tag extraction model evaluation results
By the table 3 It can be seen that , Compared to traditional CNN+BiLSTM+CRF Model , Whether our model is for AI Overall identification of markers , Or the individual AI Individual identification of markers , stay F1、Recall、precision The effect of the three indexes has been improved . Besides , Combined with black and white list and other rules to optimize , We model F1 by 0.864,Recall by 0.876,Precision by 0.853.
3.2.4 AI Mark normalization
For some that have multiple representations AI Mark , We have developed a series of rules and strategies to normalize . for example , For the method 「Long Short-Term Memory」, We will 「LSTM」、「LSTM-based」、「Long Short-Term Memory」 And so on 「LSTM (Long Short-Term Memory)」. For indicators 「accuracy」, We will 「mean accuracy」、「predictive accuracy」 Etc 「accuracy」 All of the indexes are normalized to 「accuracy」. The detailed normalization strategy is shown in the appendix A. In the case of polysemy , Considering a lot of AI Tags can be distinguished by entity category , And the probability of polysemy of the same type is very small , We don't deal specifically with this situation .
3.3 AI Mark the source of the original paper
To get a method or data set from the beginning of the proposed gradually cited by other literature traces of research , First, we need to trace back to the original literature of methods and datasets . We refer to the methods and data sets traced back to the original literature as 「 The original paper 」. We only trace the methods or data sets that appear in subsequent literature or experimental chapters .
3.3.1 Traceability Method
Consider that in a document , When a method or dataset is referenced , It is often followed by the corresponding original paper . therefore , In our proposed Traceability Method , For each AI Mark , Let's first find out the quotation AI A collection of marked documents . For each article in the literature collection , Look for the AI Mark the set of sentences that appear . For each sentence , View the AI Whether there is a reference at one or two places after the mark , Record the information with references . Last , Each one AI Mark the document with the largest number of citations as its original document .
3.3.2 Evaluate the results
Using the Traceability Method of this paper , We go back to CCF corpus The number of explicit references proposed in is greater than 1 The method of the original literature 4105 piece , Method 5118 individual . trace back to CCF corpus The number of explicit references proposed in is greater than 1 The original literature of the dataset 949 piece , Data sets 1265 individual .
The number of references in the result of random sampling is 5、4、3、2 The methods are different 200 individual , The number of times it is explicitly quoted is 5、4、3、2 The data sets of the 100 individual . For this 800 A way and 400 Data sets corresponding to the original literature results are evaluated manually , The evaluation results are shown in the table 4. The results are more accurate than 90%.
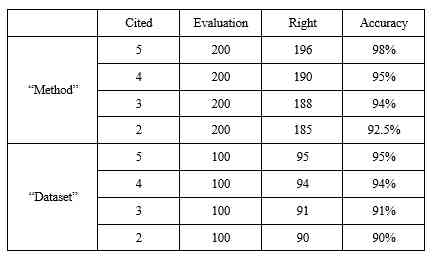
Table 4: The evaluation results of the Traceability Method
3.4 Methods and clustering of research scenarios
A single data set or a single indicator may correspond to multiple different research scenarios . for example CMU PIE The data set and accuracy The combination of indicators is represented as the research scene of face recognition ,IMDB The data set and accuracy The combination of indicators is expressed as the research scene of emotion classification of film reviews . therefore , We combine data sets and indicators from a literature to represent the Research scenario , Then a large number of redundant research scenarios are obtained .
Many indicators are applied at the same time , such as precision、recall etc. , therefore , First, we need to combine the indicators , To reduce the redundancy of research scenarios .
We construct a method based on the number of co-occurrence of methods and research scenarios in the literature - Study the scene matrix . Because there are many combinations of data sets and indicators , It makes the number of research scenarios very large , It's the method - High dimensional sparsity of scene matrix . To solve the problem , We learn from Nonnegative Matrix Factorization (NMF) [1, 11] And spectral clustering [16], The algorithm of dimension reduction and clustering is constructed .
First , We combine data sets and indicators into research scenarios , According to the method and Research scenario co-occurrence relationship , How to get it - Study the scene co-occurrence matrix . secondly , be based on NMF And spectral clustering to cluster the method , obtain 500 Class method family . then , According to the index - Methods cluster co-occurrence matrix was used to cluster the indexes , obtain 50 Class index cluster . The Research scenario is composed of index cluster and data set , According to the method - Study the co-occurrence matrix of the scene, and cluster the scene spectrum , obtain 500 Class studies scene clusters . We expect the number of research scenarios in each cluster to be generally balanced , So it will include the number of research scenarios 500 The above clusters are again based on the method - The co spectral scene matrix is studied . Altogether 2 The number of research scenarios contained in clusters is in 500 above , After clustering again, we get 200 Class studies scene clusters . Will this 200 Class studies scene clusters and the rest 498 Class research scene cluster merge to get 698 Class studies scene clusters .
3.5 Method the generation of path graph in cluster
The method roadmap describes the evolution of different but highly relevant methods [28]. In the method cluster obtained by the above clustering algorithm , Each type of method cluster is composed of methods of the same type . In this cluster , If you can build a time-based approach to evolution , And add data set information , It will provide very enlightening information for related research .
The generation process of path graph in the method cluster proposed in this paper is as follows :
For a method cluster , Obtain the original literature information of all the methods it contains : Put forward the time 、 Methods in the chapter of the paper that proposed the method 、 This method corresponds to the data set used in the original paper ;
For each method in the method cluster M_i, Find out the other methods mentioned in the experimental section of the original paper . structure M_i To The path of each method M_iM_j, M_j,∈.M_i And M_j The edge between is M_i and M_j The data set used for comparison ;
Merge continuous paths , Get the path map of the same method .( for example , If there is (M_1M_2), (M_2M_3), (M_1M_3), Only keep (M_1M_2), (M_2M_3)).
Our roadmap is constructed in the same way as [28] There are two differences between the methods in :1) We've added relationships to datasets , Methods and methods are linked through data sets , This provides additional information ;2) We use large-scale literature to get methods , You can get a lot of path maps at the same time .
3.6 Study the impact of scene clusters
This paper analyzes the influence degree between scene clusters , And the influence of the effective method of tracing back on other research scene clusters .
According to the corresponding relationship between the research scene and the research scene cluster , We find out the cluster of research scenarios in each literature . Considering that a paper generally only deals with 1 Class main research scenarios , therefore , We take the research scene cluster with the largest number of times as the corresponding research scene cluster of the literature . In the end we got CCF corpus in 45,215 The research scene clusters corresponding to the articles . Combined with this 45,215 Articles and their effective methods , We analyzed this 45,215 In this paper, we study the interaction between scene clusters , And the impact of the effective methods proposed in these literatures on other research scenarios .
We will cluster the research scenarios into s The collection of documents is defined as Ls,. The effective method proposed in the literature has been quote , Scene clusters are not s The collection of documents in this paper is . Study scene clusters s For other research scenarios \s The ratio of influence degree is calculated as follows 1 Shown :

among , For the literature corresponding to the research scene cluster in 45,215 Distribution in papers , Indicates that the research scenarios corresponding to the literature are clustered in 45,215 Distribution in papers . For calculating and JS The divergence .
Besides , This paper analyzes this 45,215 The impact of the effective methods proposed in this paper on other research scenarios clusters .
We will be effective in m The corresponding original literature is expressed as l_m, The literature l_m The corresponding research scene cluster is s, Effective methods have been cited within three years m And the scene cluster is not s The collection of documents in this paper is . Effective method m The degree of impact on the research scene cluster ID_m And impact ratio IDR_m The calculation formula is as follows :


among , by l_m The corresponding research scenes of the literature are clustered in 45,215 Distribution in papers , The research scenarios corresponding to the literature are clustered in 45,215 Distribution in papers . For calculating and JS The divergence .
4 result
This section is based on the above method , Including chapter classification 、AI Mark extraction and normalization 、AI Mark the source of the original documents 、 Methods and clustering of research scenarios 、 Methods the path map within the cluster was generated and the influence degree of scene cluster was studied , For the collected CCF corpus(2005-2019 Year of AI The paper ) Based on AI Statistical analysis of markers 、 Communication analysis and mining , And show the results .
4.1 It works AI Statistics of tags
We extract CCF corpus Medium AI Mark , obtain 171,677 A machine learning method entity 、16,645 Data set entities 、1551 Index entities . Consider a lot of once only AI Tags are basically not informative , We are only concerned about the appearance of 1 More than one time AI Tag for analysis . We will appear more than 1 Of AI The mark is called valid AI Mark .
This section describes the effective AI Mark the analysis of countries and publishing locations , And effective for the top ten in terms of annual usage AI Analysis of markers .
4.1.1 It works AI Mark the analysis of the country
One country put forward effective AI The number of markers can reflect the country Of AI Research strength . therefore , First of all, we are right CCF corpus Countries in China are in 2005-2019 The effective methods and the number of datasets proposed in 1999 were statistically analyzed , Pictured 4 Sum graph 5 Shown .
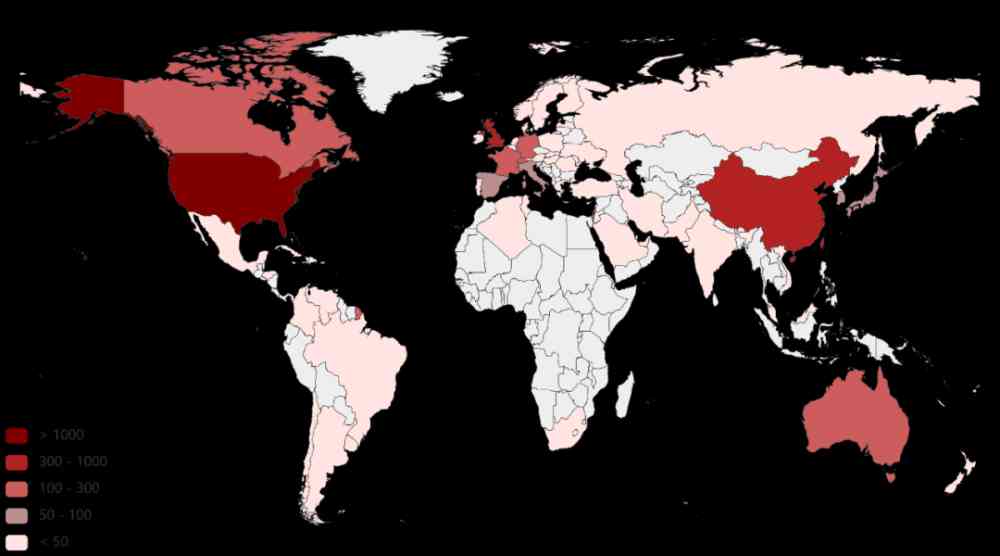
Figure 4: Traced back to CCF corpus The quantitative distribution of the proposed effective method in different countries
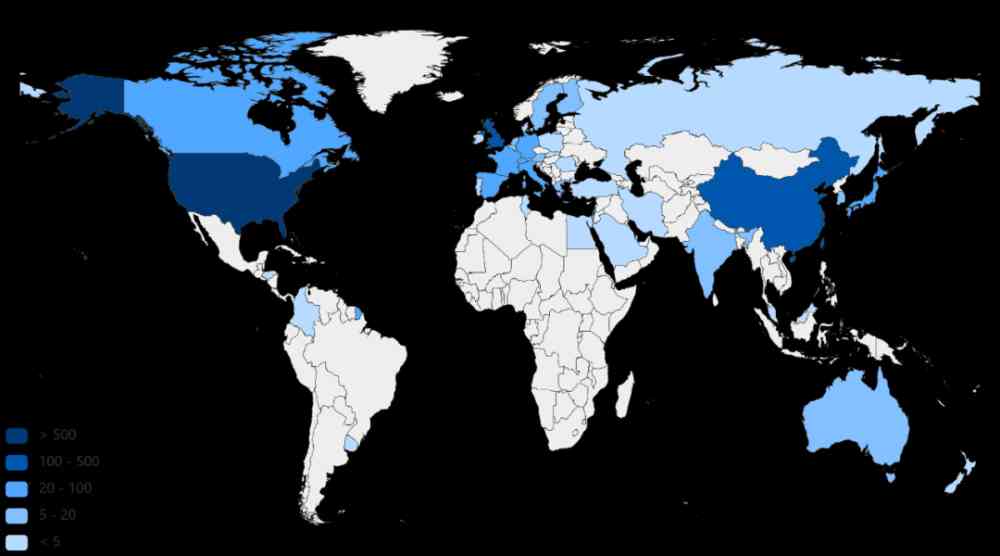
Figure 5: Traced back to CCF corpus The quantitative distribution of the proposed effective data sets in different countries
From the figure 4 We can see that , The top three in the number of effective methods proposed are the United States 、 China 、 The British . Germany 、 The French 、 Canada 、 Singapore 、 Australia and other countries put forward the number of effective methods followed by . From the figure 5 We can see that , The United States is also the top three in terms of the number of effective data sets 、 China 、 The British . Germany 、 Switzerland 、 Canada 、 The French 、 Singapore 、 The number of valid data sets proposed by countries such as Israel is the second . From this we can see that , The United States 、 China 、 The UK is a relatively more active country in machine learning . Germany 、 The French 、 Canada 、 Although Singapore and other countries are similar to the United States 、 China 、 There is a certain gap in Britain , But it's also relatively active .
In order to reduce the impact of the number of papers published in each country on the results of the analysis , We are right. CCF corpus The number of effective methods proposed in the top ten countries in the number of effective methods proposed and the rate of effective methods proposed by the top ten countries in the table and CCF corpus In this paper, we analyze the effective data set presentation rate of the top ten countries in terms of the number of effective data sets .
Country c The rate of proposing effective methods MRc、 The presentation rate of valid data sets DRc The calculation is as follows 4 and 5 Shown .
among , Express CCF corpus China c The set of all the effective methods proposed , Express CCF corpus China c The set of all valid data sets proposed , It means that CCF corpus China c A collection of all the literature .
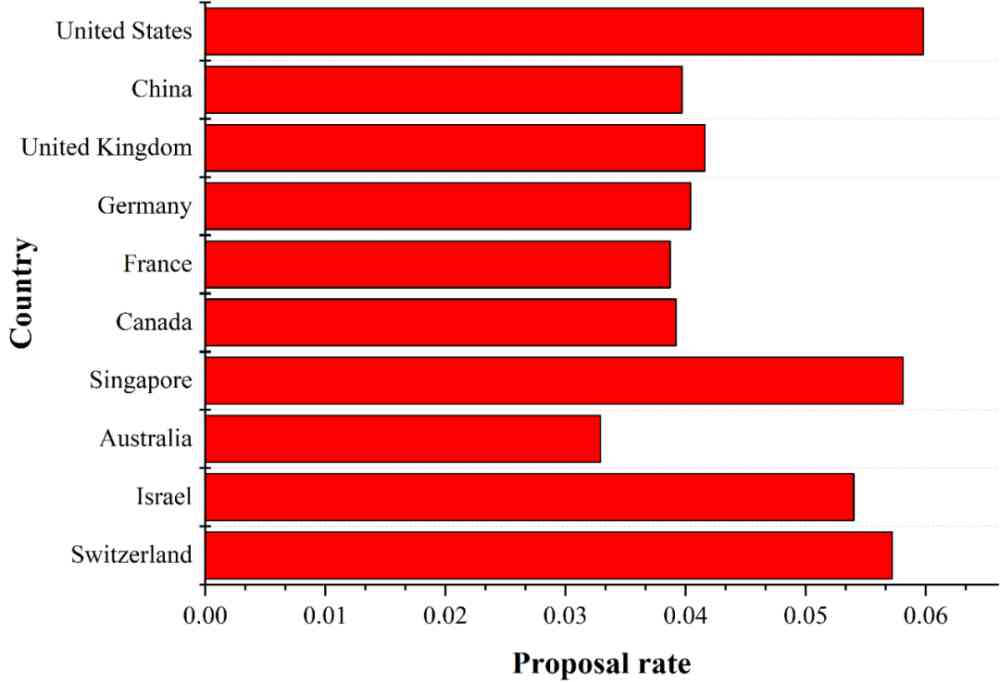
(a) chart 4 Before ranking 10 The rate of effective method proposed by the State .
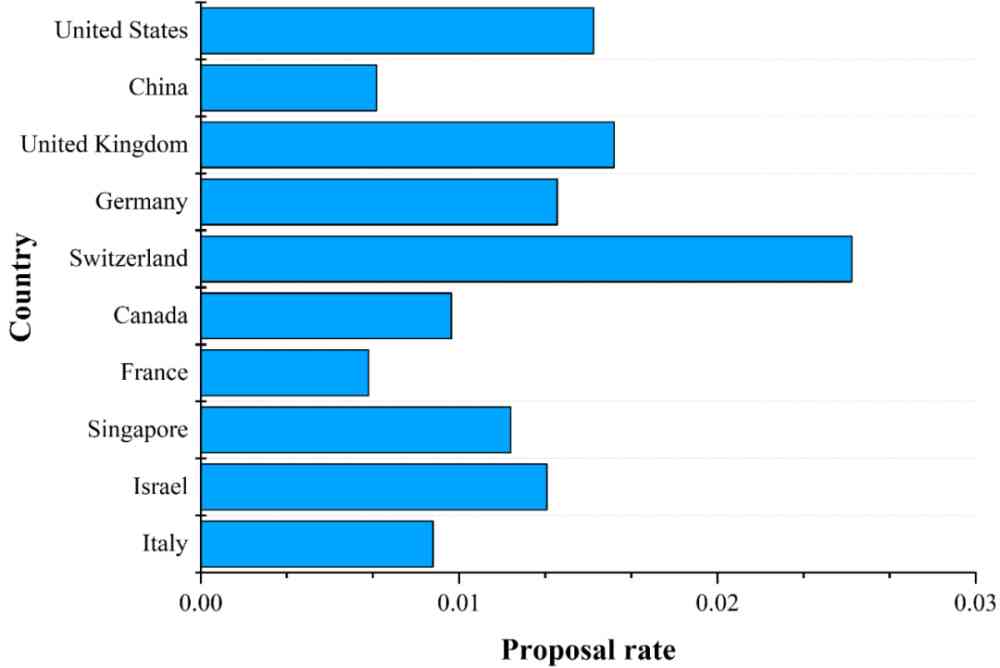
(b) chart 5 Before ranking 10 Country's effective data set presentation rate .
Figure 6: chart 4 Sum graph 5 Before ranking 10 Effective in the country AI The rate of tag presentation . The state put forward AI The number of markers decreases from top to bottom .
Based on the formula (4) and (5), We calculated the number of effective methods proposed and ranked top 10 The number of effective methods and the number of effective data sets ranked top in the countries with the highest number of effective methods proposed 10 The rate of presentation of valid data sets in countries of , The result is shown in Fig. 6 Shown .
From the figure 6a We can see that , The number and proportion of effective methods put forward by the United States are the first . Although the number of effective methods proposed by China and the United Kingdom is relatively high , But the rate of proposing effective methods is lower than that of Singapore 、 Israel 、 Switzerland . From the figure 6b You know , Although Switzerland proposes that the number of valid data sets is lower than that of the United States 、 China 、 The British 、 Germany , But it's the highest presentation rate of data sets , It reflects that Switzerland attaches great importance to AI Data sets .
4.1.2 It works AI Mark the analysis of the place of publication
A place of publication presents valid AI The number of marks can reflect the quality of the publishing location . Place of publication v The rate of proposing effective methods MRv、 The presentation rate of valid data sets DRv The calculation is as follows 6 and 7 Shown .
among ,M_v Express CCF corpus Chinese publishing place v The set of all the effective methods proposed ,D_v Express CCF corpus A collection of all valid data sets proposed by the publishing location in ,L_v It means that CCF corpus Published at the place of publication v A collection of all the literature .
Use the formula 6 and 7, We calculated the number of effective methods proposed and ranked top 10 The number of effective methods and the number of effective data sets in the publishing sites ranked first 10 The rate of presentation of valid data sets in the publishing locations of , The result is shown in Fig. 7 Shown .
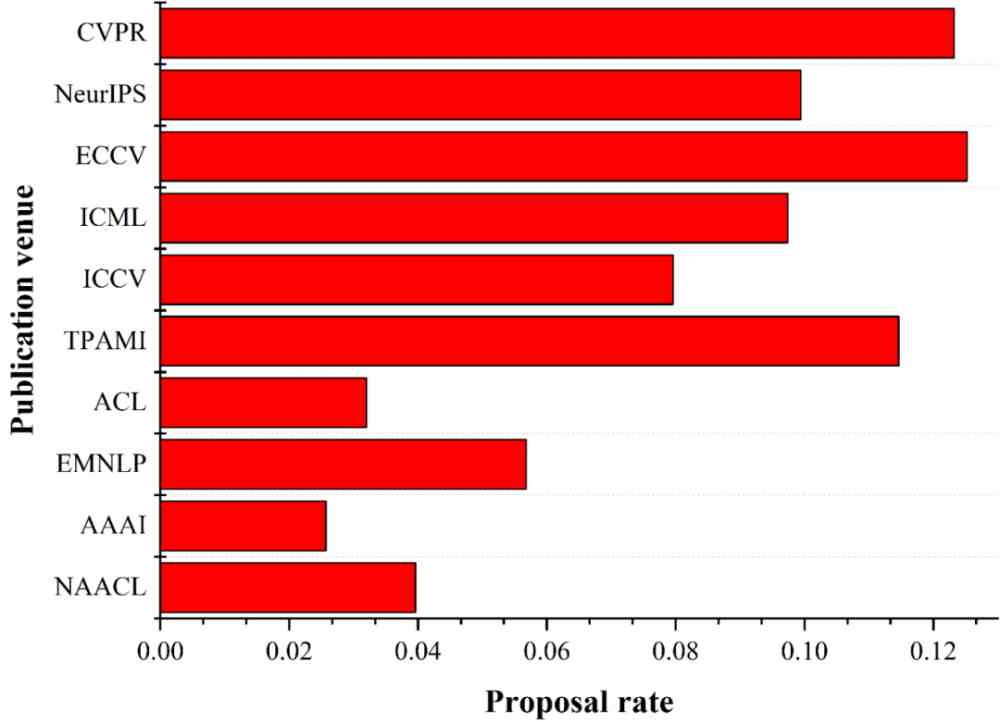
(a) Come up with effective ways to rank top 10 The effective method presentation rate of the publishing location .
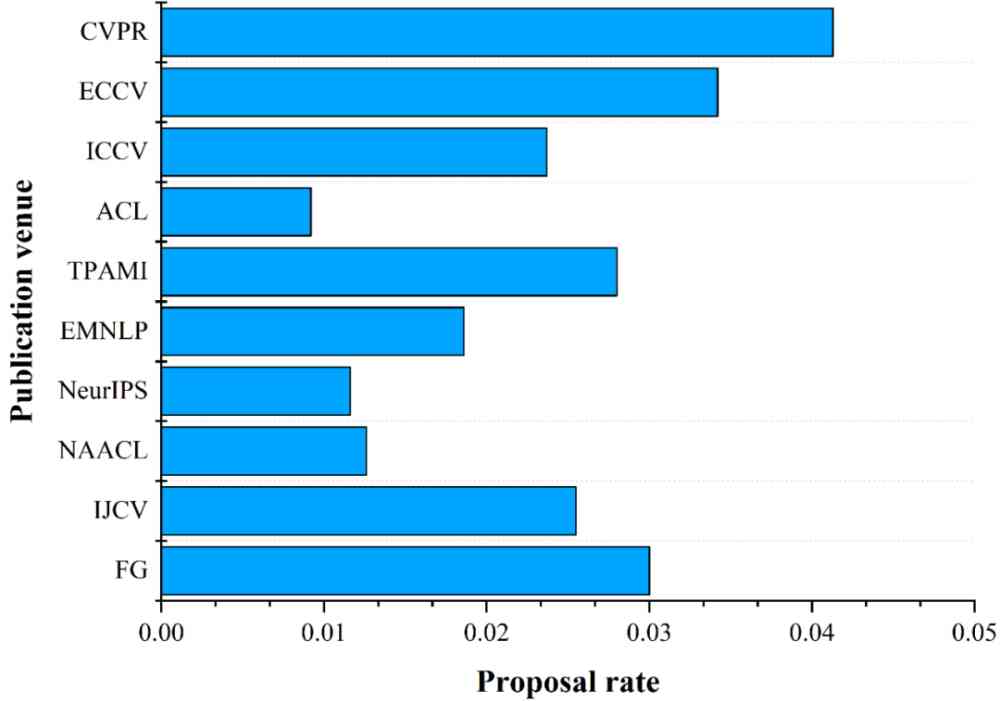
(b) Put forward effective data set ranking top 10 The effective data set presentation rate of the publishing location .
Figure 7: Put forward effective AI Mark the top 10 The effective location of the publication AI The mark raising rate . Put forward by the place of publication AI The number of markers decreases from top to bottom .
From the figure 7a We can see that , ECCV Although it is CCF Of B Class meeting , However, the effective method proposed rate is higher than that CVPR. Of the top 10 publishing locations that have come up with effective methods , Yes 7 All of them are A Where the class was published , This explanation A The quality of papers published in this category is really better than B and C Class high .
chart 7b It shows the distribution of valid data sets . We can see that ,CVPR The number of more effective data sets and the rate of presentation ranked first .ECCV Although it is B Class meeting , However, the number and rate of effective data sets proposed are second only to CVPR. Among the top ten publishing locations that present the number of valid datasets , Yes 6 Yes A Where the class was published , Also reflects A Class publishing sites do pay more attention to the presentation of effective data sets .
4.1.3 Use the top 10 effective ranking numbers per year AI Mark
This section deals with 2005-2019 Statistical analysis of the number of effective methods and data sets used each year during the year .
(1) The number of uses per year ranks top 10 Effective method
We are right. 2005-2019 The number of effective methods used each year during the year was counted , The effective ways to rank in the top ten each year are shown in the figure 8 Shown .
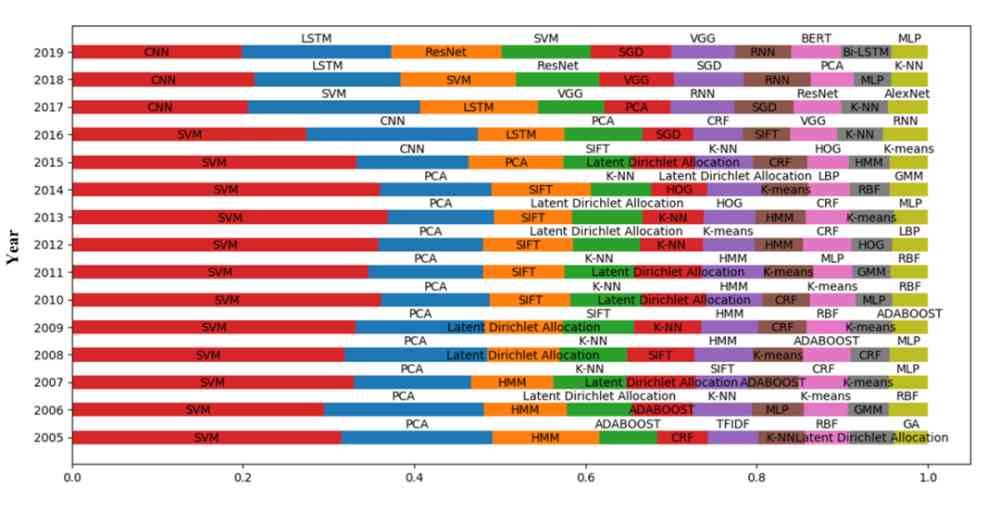
Figure 8: Use the top 10 effective methods of quantity each year
From the figure 8 It can be seen that ,SVM As a traditional machine learning method , It's widely used every year .LDA As a classic topic model for text mining , stay 2005-2015 It has been widely used in the past ten years . But with the rapid development of deep learning , stay 2015 Years later , The proportion of its use decreased significantly .2015 Years later , Deep learning is becoming more and more popular , Deep learning methods become AI Mainstream in the field .
Computer vision and natural language processing are AI Two important research subjects in research . From the figure 8 You know , Methods in computer vision always occupy a large proportion , This shows that computer vision has always been AI The hot research branch of .
(2) The number of uses per year ranks top 10 The valid data set of
We counted the number of valid datasets used each year , The top ten effective data sets in each year are shown in the figure 9 Shown .
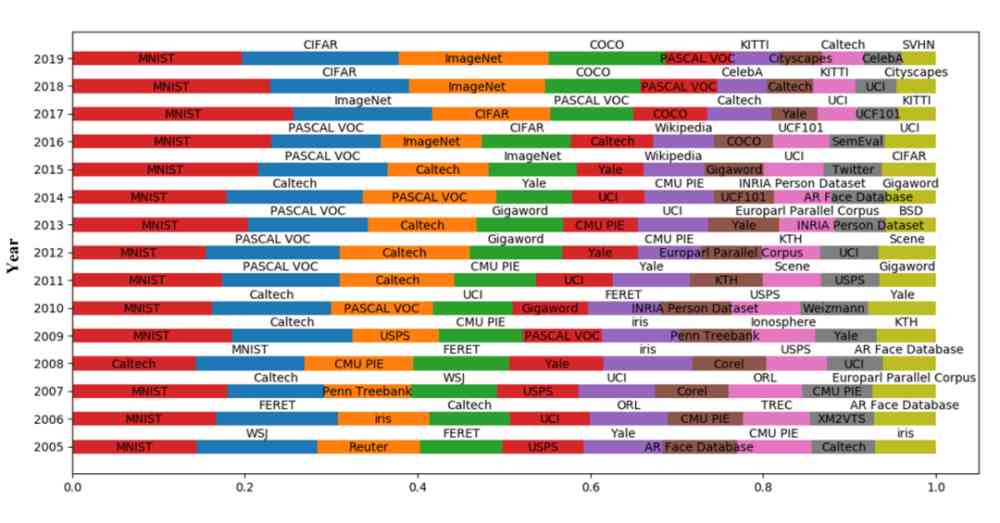
Figure 9: Use the top 10 valid data sets per year
From the figure 9 You know ,MNIST As one of the most classic datasets , It's widely used every year .2016 year ,SemEval Data sets are in the top 10 , and SemEval Data sets are commonly used data sets for sentiment analysis . It can be seen from this that ,2016 year , Emotional analysis has been widely concerned .2017 year ,KITTI Data sets are in the top 10 , and KITTI Datasets are classic datasets in the field of unmanned driving , explain 2017 The field of driverless driving has received extensive attention in , And in 2017-2019 During the year ,KITTI The proportion of data sets in the top ten data sets each year gradually increases . Besides , We can also see from the figure that , General data sets are published , It will take at least two years to be recognized and widely used in the corresponding fields . such as PASCAL VOC Data sets 2007 Released in ,2009 It is widely used ;Weizmann Data sets 2006 Released in ,2010 It is widely used ;COCO Data sets 2014 Released in ,2016 It was widely used in .
Face recognition is a hot research direction in the field of computer vision . We rank top of each year 10 The proportion of face recognition data set in effective data set is statistically analyzed , As shown in the table 5 Shown .
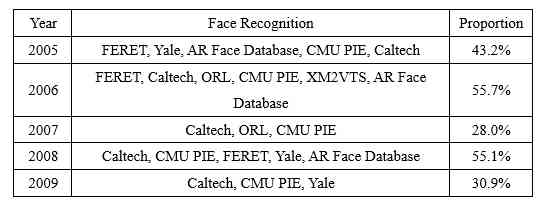
Table 5: Top of the list every year 10 The proportion of face recognition data set in the effective data set of
surface 5 Show ,2005-2019 The most commonly used data sets for face recognition are Caltech、Yale、CMU PIE、CelebA.Caltech In the top ten effective data sets each year, the proportion is high .Yale There are also many years of emergence , But in CelebA When data sets appear , Its status is CelebA replace .
4.2 The spread of effective methods
This section analyzes the spread of effective methods on datasets and between countries .
4.2.1 Propagation over data sets
We are right. 2005 Year to 2019 Every year from CCF corpus In this paper, we analyze the spread of the effective methods on the dataset .y An effective method was put forward in y To y+△y The formula for calculating the propagation rate on the dataset within the time interval is as follows :

among ,M_y All in y The method proposed in , It means that y To y+△y Time intervals are applied to methods m Set of data sets on ,.
Based on the formula 8, We get every year by CCF corpus The effective method proposed is within one year 、 Two years, 、 The spread rate on the dataset over three years , Pictured 10 Shown .
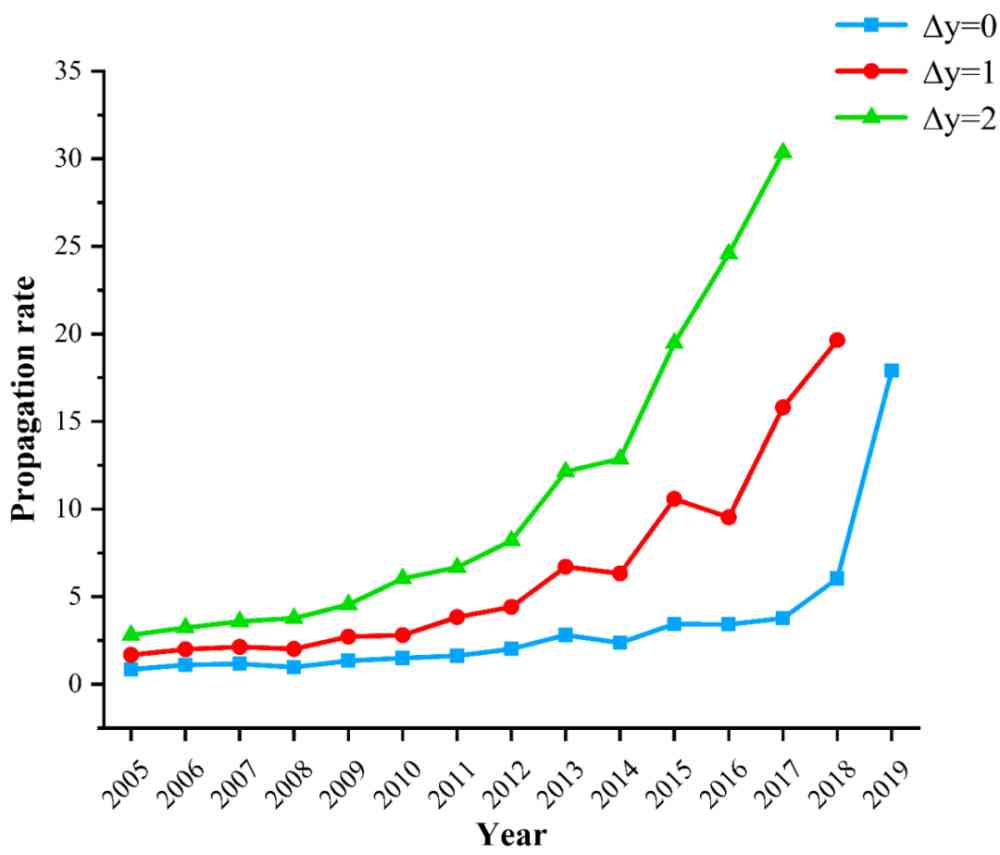
Figure 10: The propagation rate of effective methods on the dataset
From the figure 10 You know , Over time , The spread rate of effective methods on data sets is increasing gradually , Various well-known methods were adopted before the literature was officially published arxiv The channel is well known .
Besides , We are also right 2005 Year by year CCF corpus It was put forward in the original documents of the Central Plains Large margin nearest neighbor (LMNN) Methods and 2018 Year by year CCF corpus It was put forward in the original documents of the Central Plains Transformer The method starts with spreading to other literature , In the past two years, the application of data sets has been compared , Pictured 11 Shown .
From the figure 11 You know ,Transformer stay 2018 After it was proposed in ,2018 Years and 2019 It's been applied to many different datasets . However 2005 Was proposed in LMNN, stay 2006 It began to be cited in other literatures in 1997 , Applied to different datasets . also , We can also see clearly that ,Transformer From spreading to other documents , The number and variety of applications on data sets in two years are much more than LMNN. It also reflects that over time , Methods are spreading faster and faster on datasets .
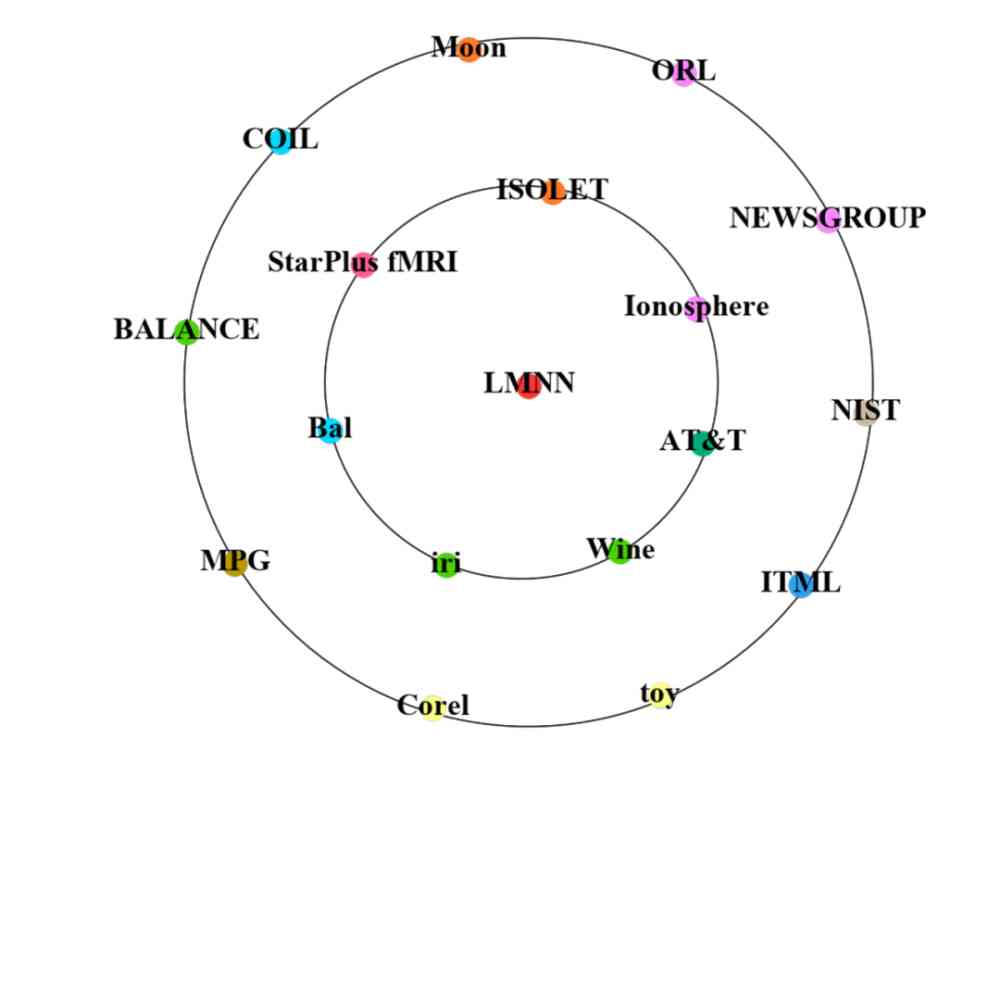
a) LMNN 2006 year ( Inner circle ) and 2007 Data sets applied in .
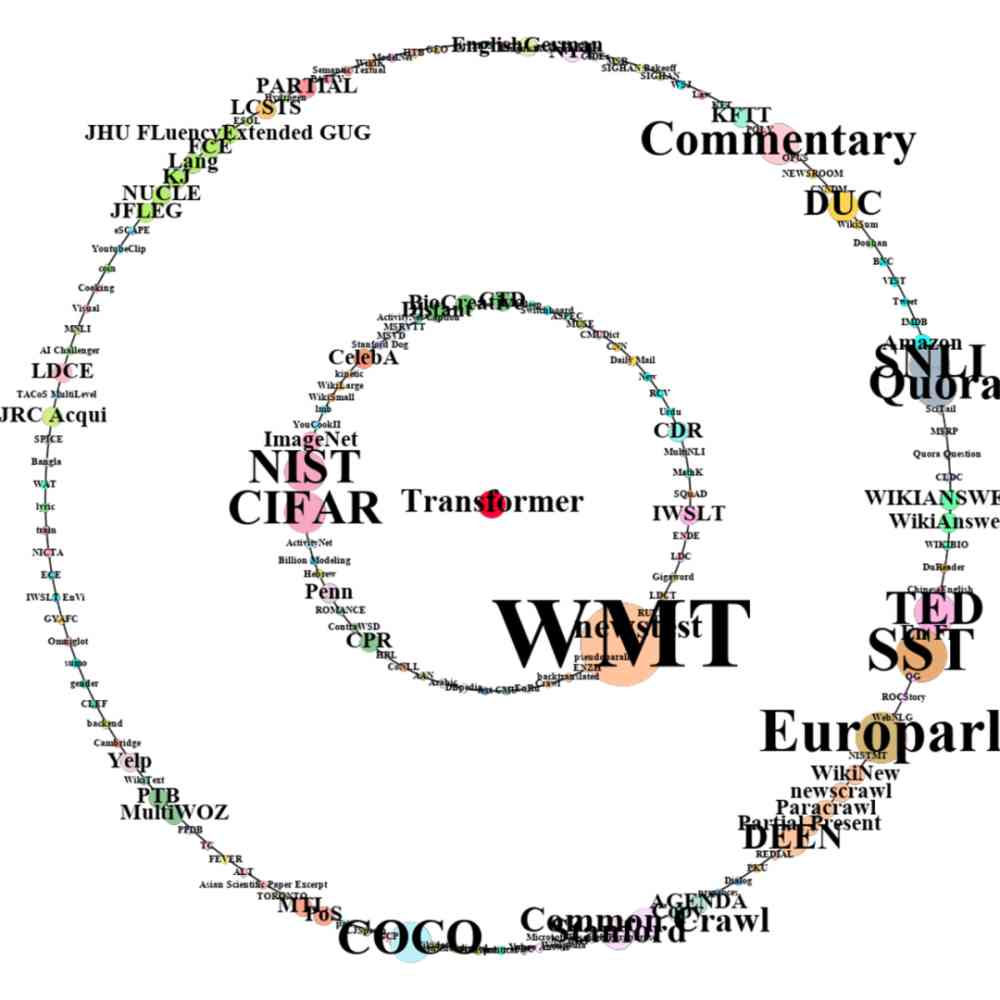
b) Transformer 2018 year ( Inner circle ) and 2019 Data sets applied in .
Figure 11: Data set of effective method application , The red dot in the middle represents the method . The inner and outer rings consist of many data set points , In the dataset point , The size of the point represents the number of datasets that the method is applied to , The colors of the points in different datasets represent different research scenarios .
4.2.2 Communication between countries
This section analyzes the spread of effective methods across countries . We will state c The set of all the effective methods proposed is defined as M_c,. stay y To y+△y Within the time interval , The effective way is by the State c To the country c’ The calculation of the degree of transmission is as follows 9 Shown .
Among them is in y To y+△y Within the time interval , In the chapter of the experiment m Of c’ Collection of national papers . For in y To Within the time interval , In the chapter of method introduction, it is quoted that m Of c’ Collection of national papers , .
Based on the formula 9, We use 5 Year is a stage , Yes 2005-2009 year 、2010-2014 year 、2015-2019 The degree of spread of the effective method between countries is calculated . The spread of effective methods among the top ten countries in each stage is shown in the figure 12 Shown .
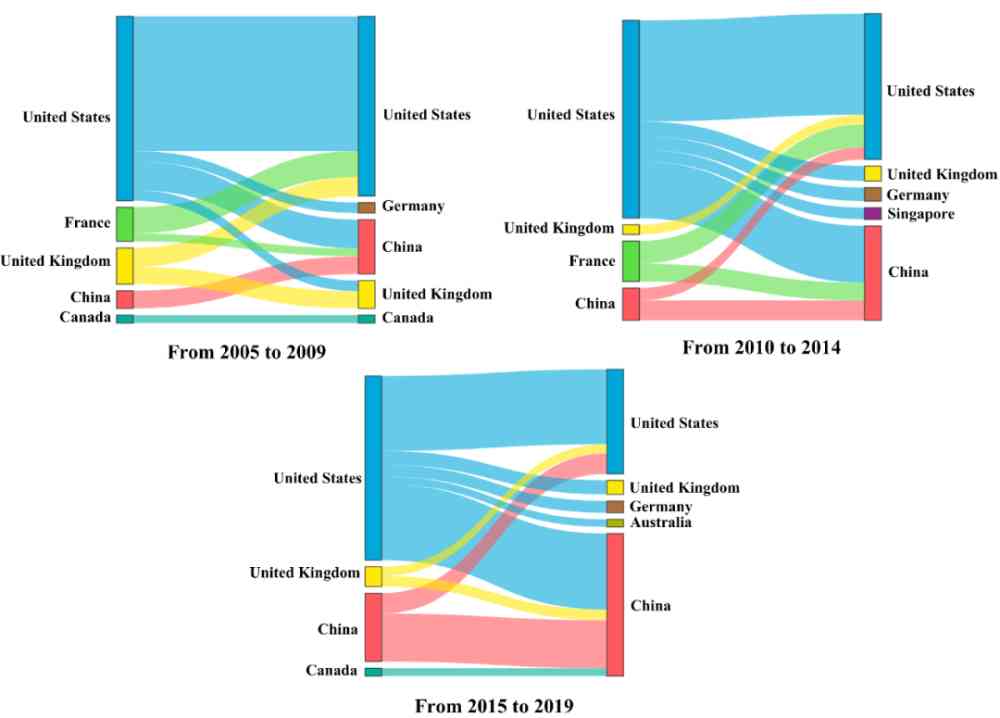
Figure 12:2005 Year to 2019 year , The extent to which effective methods are disseminated between countries top10.
From the picture 12 It can be seen that , The effective way is in 2005-2009 More from the United States 、 France and Britain spread to other countries . Relatively speaking , The effective method proposed by China has a low degree of dissemination . stay 2010-2014 year , The spread of China's proposed methods is increasing , And here it is 2015-2019 year , The spread of China's proposed method to the United States has jumped to the fourth place . Reflecting China's AI Better and better . contrary , The method proposed by France is in 2005-2014 The annual transmission is relatively large . And by the 2015-2019 year , France's proposed method ranks behind ten in terms of dissemination , It reflects the French AI Relatively slow development .
4.3 The results of the roadmap and research scenarios
This section introduces the path map of the method and the analysis of the research scene cluster .
4.3.1 Method path map case study
We analyze two common methods of knowledge representation learning and generative confrontation in knowledge mapping . Using the path map generation algorithm proposed by us to 'Trans' Cluster and 'GAN' The method path map in the cluster is drawn .
chart 13 yes 'Trans' Method paths in clusters . Jing and Ji wait forsomeone [9] Check the contents of published documents ,'Trans' The method path map in the cluster contains the mentioned in the above paper 76% Knowledge representation of learning algorithm , At the same time, it also contains some methods related to knowledge representation learning . for example :GMatching and KGE It's graph embedding ,HITS It's link analysis .
Besides , From the figure 13 You can visually see the time when each method is proposed , for example :TransE stay 2013 in ,TransH2014 in . meanwhile , We can see TransE The method node has the largest out degree , On the one hand, it explains many methods, such as CTransR、RTRANSE Wait is from TransE The method is inspired , And then develop new methods . On the other hand , Also explain TransE It is a representative knowledge representation learning method , Many new knowledge representation methods are compared with them . Besides , From the picture , We can also see that 'Trans' The data set used by the methods in the cluster .
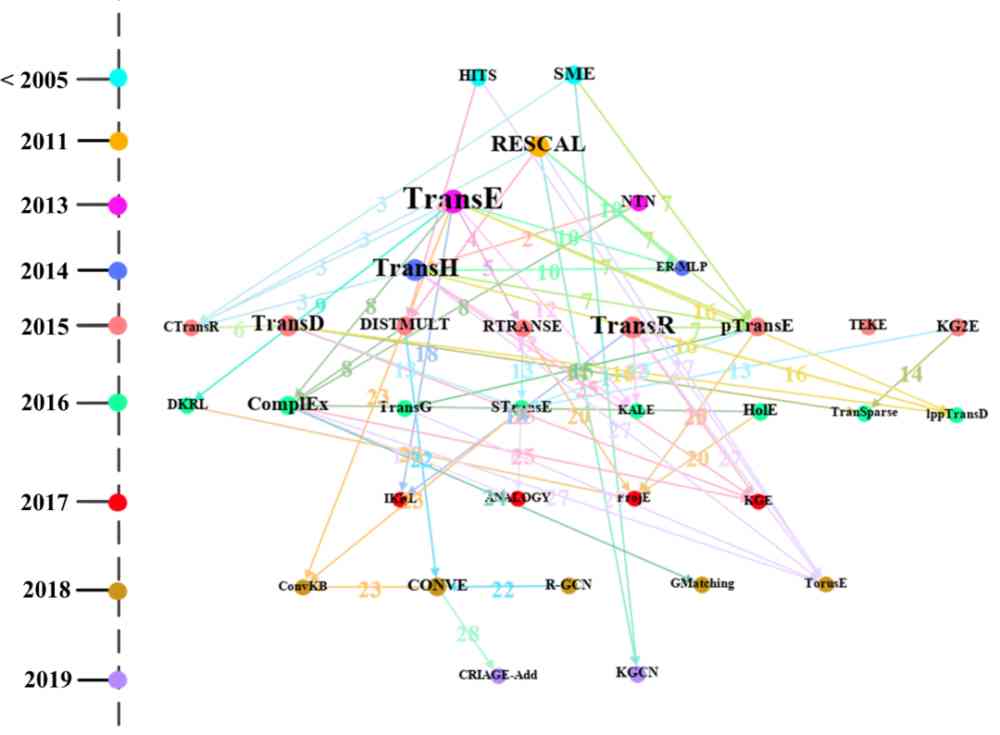
Figure 13:'Trans' The path map of the method in the cluster , The colors in the dots indicate the year , The size of the point indicates the degree , The color of the line represents the data set represented by the number .
The numbers in the figure indicate the path MiMj in Mi and Mj The data set used for comparison , Specific for :1: WIKILINKS 2: WIKILINKS;WN;FB 3: WordNet;FB;WN;Freebase 4: ClueWeb 5: Family 6: FB;WN 7: Freebase;NYT;YORK 8: WordNet;Freebase;WN 9:null 10: RESCAL;WordNet;WN 11: Freebase 12: WordNet;Freebase 13: ClueWeb;WN 14: FB;WN 15: WordNet;FB;WN;Freebase 16: FB;WN 17: null 18: KG;ImageNet;WN 19: null 20: DBpedia 21: FB;WN 22: WN;YAGO;WNRR 23: WNRR;HIT;MR
24: Wikione;NELLone;NELL 25: WNRR;WN 26: WordNet;WN 27: WordNet;Freebase;WN 28: YAGO
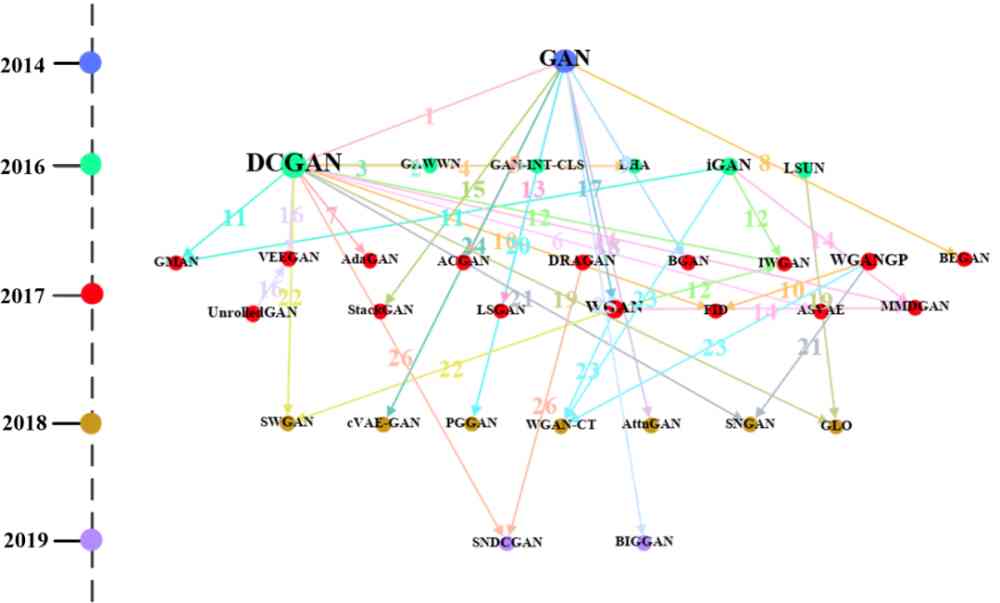
Figure 14:'GAN' The path map of the method in the cluster , The colors in the dots indicate the year , The size of the point indicates the degree , The color of the line represents the data set represented by the number .
The numbers in the figure indicate the path MiMj in Mi and Mj The data set used for comparison , Specific for :1: Face;NIST;SVHN;CelebA 2: CUB(CU Bird);Oxford Flower;Oxford 3: CUB(CU Bird);MPII Human;Caltech;MHP(Maximal Hyperclique Pattern) 4: ILSVRC;SVHN 5: ImageNet 6: NIST;CIFAR;ImageNet 7: NIST 8: CelebA 9: NIST;CIFAR;SVHN 10: BLUR;LSUN;SVHN;CIFAR;Noise;CelebA;LSUN Bedroom 11: NIST;SVHN;CIFAR 12: Google;LSUN;LSUN Bedroom 13: Google 14: NIST;LSUN;CIFAR;CelebA;LSUN Bedroom 15: CUB(CU Bird);Oxford 16: NIST;CIFAR 17: LSUN;CIFAR;LSUN Bedroom 18: ImageNet;COCO 19: NIST;SVHN;LSUN;CelebA;LSUN Bedroom 20: LSUN;CelebA;LSUN Bedroom 21: null 22: NIST;LSUN;CIFAR;CelebA;LSUN Bedroom 23: NIST;SVHN;CIFAR 24: poem;Chinese Poem 25: CONFER 26: null
chart 14 yes 'GAN' Method paths in clusters . Jing and Hong wait forsomeone [7] Check the contents of published documents ,'GAN' The path map of the methods in the cluster contains the mentioned in the above paper 75% The algorithm of generating antagonism class of . Besides , From the figure 14 You can visually see the time when each method is proposed , for example :GAN yes 2014 Put forward in ,DCGAN yes 2016 Put forward in . meanwhile , We can see DCGAN The method node has the largest out degree . On the one hand, it explains many methods, such as AdaGAN、SNDCGAN It's from DCGAN Inspired by , And then develop new methods . On the other hand , It can also be found ,DCGAN As a representative method of generating confrontation , Many of the newly proposed methods of generating adversary classes are often associated with DCGAN Contrast . Besides , From the picture , We can also see that 'GAN' The data set used by the methods in the cluster .
4.3.2 The results of studying scene clusters
from 3.6 The formula in Section 1, We get the ratio of interaction intensity between scene clusters . Considering only being 1 The number of research scenarios affected or included in the original literature is too small, and the amount of information contained in the cluster of research scenarios is not much , There are too many research scenarios in the research scene cluster, and the research scene information in the cluster is relatively messy . To ensure the reasonableness of the result , We only consider the number of scenes contained between 15-20 Between ( contain 15 and 20) The research scene cluster is analyzed .
Get the most easily affected by other research scene clusters top3 Study scene clusters : Color constancy 、 Image memory prediction 、 Multi core learning , And the one that is least affected by other research scene clusters top3 Study scene clusters : Significance test 、 Pedestrian recognition 、 Face recognition .
from 3.6 The formula in Section 2 and 3, We're against 45,215 The effective method proposed in this paper calculates the influence intensity and the influence intensity ratio of other scene clusters respectively . Methods such as the annual information intensity table 7 Shown , The information of the methods that influence the intensity ratio most each year is shown in the table 8 Shown .
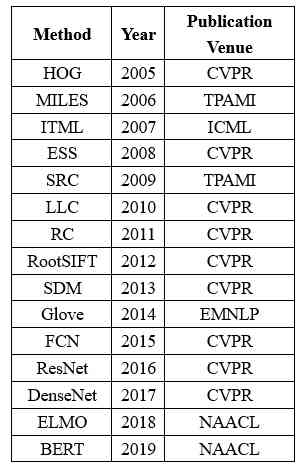
Table 7: The method information with the greatest impact intensity each year
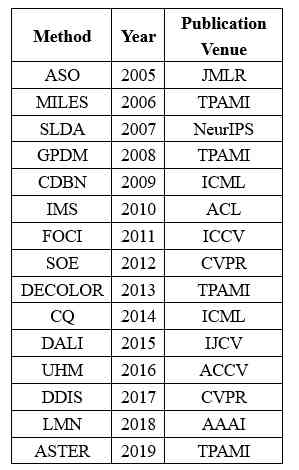
Table 8: Information about the method that affects the intensity ratio most each year
By the table 7 And table 8 We can find out ,2005-2019 Among the methods that have the greatest impact on other research scene clusters each year in , Yes 12 All of them are related to computer vision ; Among the methods that have the greatest influence on the strength ratio , Yes 10 All of them are related to computer vision . This shows that the computer vision class method is easier to affect other research scene clusters than other class methods . Besides , From the point of view of the place of publication , surface 7 Medium 15 In the literature 12 The article comes from A Class publishing location , surface 8 Medium 15 In the literature 14 The article comes from A Class publishing location , This explanation A The method proposed by the publishing site is more likely to have an impact on other research scene clusters .
5 Conclusion and future work
In this paper, we use biomarkers to track the changes of substances and cells in the process of reaction , So as to obtain the idea of response characteristics and laws , take AI The method in the literature 、 Data sets 、 The index entity acts as AI Markers of the field , Using the traces of these three named entities with the same granularity in the specific research process to study AI Development and changes in the field .
We use... First AI The tag extraction model is applied to 122,446 Methods and experiments in this paper AI Tag to extract , The effective methods of extraction and data set were statistically analyzed , Get feedback AI Important information on the annual development of the field . secondly , We trace the source of the original literature on effective methods and data sets , This paper makes a quantitative analysis of the original literature . And the propagation rules of effective methods on data sets and between countries are also explored . Discover Singapore 、 Israel 、 Switzerland and other countries put forward a relatively large number of effective methods ; Over time , Effective methods are applied to different datasets more and more quickly ; China's effective methods are becoming more and more influential in other countries , France, on the other hand . Last , We combine data sets and metrics as AI Research scenarios , Methods and research scenarios are clustered separately . Based on method clustering and association data set, the path map is drawn , Study the evolutionary relationship of similar methods . Based on the clustering results of research scenarios, this paper analyzes the impact of the method on the research scenarios and between the research scenarios , It is found that saliency detection, which is a classical computer vision research scene, is the least affected by other research scenarios .
In the future work , We will be on AI Mark extraction model is improved , Optimize its extraction performance , And try to from AI Tables of literature 、 Image extraction AI Mark , More comprehensive 、 To realize exactly to AI Tag extraction , And show more accurately AI The development of the field . Which is the best hospital in Zhengzhou
版权声明
本文为[Gu Yansheng]所创,转载请带上原文链接,感谢
边栏推荐
- Using NLP and ml to extract and construct web data
- 一篇文章教会你使用Python网络爬虫下载酷狗音乐
- WeihanLi.Npoi 1.11.0/1.12.0 Release Notes
- 6.2 handleradapter adapter processor (in-depth analysis of SSM and project practice)
- Relationship between business policies, business rules, business processes and business master data - modern analysis
- Three Python tips for reading, creating and running multiple files
- 一篇文章带你了解CSS 渐变知识
- Common algorithm interview has been out! Machine learning algorithm interview - KDnuggets
- The data of pandas was scrambled and the training machine and testing machine set were selected
- Introduction to the structure of PDF417 bar code system
猜你喜欢

Building and visualizing decision tree with Python

一篇文章教会你使用Python网络爬虫下载酷狗音乐

Shh! Is this really good for asynchronous events?

A brief history of neural networks

文件过多时ls命令为什么会卡住?

Brief introduction of TF flags

Pattern matching: The gestalt approach一种序列的文本相似度方法

Mac installation hanlp, and win installation and use

Python基础变量类型——List浅析

Flink的DataSource三部曲之一:直接API
随机推荐
Brief introduction and advantages and disadvantages of deepwalk model
How to customize sorting for pandas dataframe
ES6学习笔记(四):教你轻松搞懂ES6的新增语法
[efficiency optimization] Nani? Memory overflow again?! It's time to sum up the wave!!
一部完整的游戏,需要制作哪些音乐?
每个大火的“线上狼人杀”平台,都离不开这个新功能
Basic usage of GDB debugging
use Asponse.Words Working with word templates
DRF JWT authentication module and self customization
Construction of encoder decoder model with keras LSTM
開源一套極簡的前後端分離專案腳手架
Get twice the result with half the effort: automation without cabinet
C + + and C + + programmers are about to be eliminated from the market
C語言I部落格作業03
[C] (original) step by step teach you to customize the control element - 04, ProgressBar (progress bar)
新建一个空文件占用多少磁盘空间?
html+vue.js 實現分頁可相容IE
Free patent download tutorial (HowNet, Espacenet)
Analysis of partial source codes of qthread
Lane change detection