当前位置:网站首页>Matplotlib绘图快速入门
Matplotlib绘图快速入门
2022-07-06 09:24:00 【ブリンク】
Matplotlib绘图快速入门
文章目录
- Matplotlib绘图快速入门
- 一、面向过程绘图
- 1.常用的绘图类型
- (1) p l o t ( ) plot() plot():曲线图
- (2) s c a t t e r ( ) scatter() scatter():散点图
- (3) b a r ( ) / b a r h ( ) bar()/barh() bar()/barh():条形图
- (4) p i e ( ) pie() pie():饼图
- (5) s t e m ( ) stem() stem():茎图
- (6) s t e p ( ) step() step():阶梯图
- (7) h i s t ( ) hist() hist():直方图
- (8) f i l l _ b e t w e e n ( ) fill\_between() fill_between():两侧填充图
- (9) i m s h o w ( ) imshow() imshow():像素图
- (10) p c o l o r m e s h ( ) pcolormesh() pcolormesh():非规范像素图
- (11) c o n t o u r ( ) contour() contour()和 c o n t o u r f ( ) contourf() contourf():等高线图
- (12) b a r b s ( ) barbs() barbs():风杆图
- (13) q u i v e r ( ) quiver() quiver():矢量图
- (14) s t r e a m p l o t ( ) streamplot() streamplot():气流图
- (15) b o x p l o t ( ) boxplot() boxplot():箱线图
- (16) e r r o r b a r errorbar errorbar:误差栏图
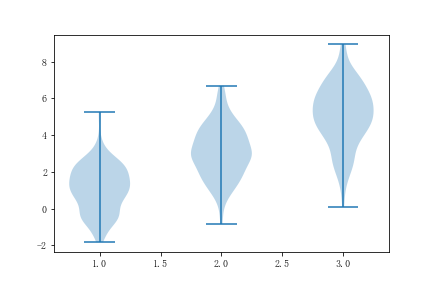
- (17) v i o l i n p l o t ( ) violinplot() violinplot():小提琴图
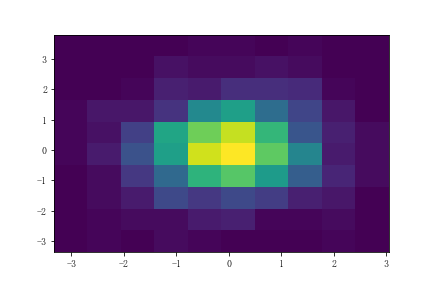
- (18) h i s t 2 d ( ) hist2d() hist2d():二维直方图
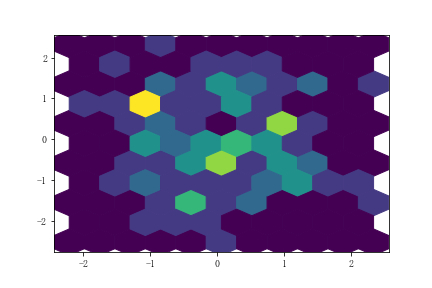
- (19) h e x b i n ( ) hexbin() hexbin():六边形直方图
- (20) t r i c o n t o u r ( ) tricontour() tricontour()和 t r i c o n t o u r f ( ) tricontourf() tricontourf():非等距等高图
- (21) t r i p c o l o r ( ) tripcolor() tripcolor():三角形彩图
- (22) t r i p l o t ( ) triplot() triplot():二维三角图
- 2.常用的绘图选项
- 二、面向对象绘图
- 三、风格美化
需要说明的是,在阅读此文章前,你应该对Numpy有一定的了解,如果你对Numpy还不太熟悉,可以查看我的另一篇文章:点击下方链接即可:
Numpy快速上手指南
使用之前,我们先导入需要用到的模块,大部分的绘图内容都包含在matplotlib的pyplot模块中,而numpy可以生成一些数据以供绘图。
import matplotlib.pyplot as plt
import numpy as np
一、面向过程绘图
所谓面向过程的绘图,就是一步一步根据你想要画成什么样子进行编程,熟悉MATLAB的同学应该知道它的绘图方式,比如:先画一个图,再添加标题、横坐标标签,纵坐标标签,图例等等,这样的方式绘图就是面向过程的绘图。
1.常用的绘图类型
(1) p l o t ( ) plot() plot():曲线图
p l o t ( ) plot() plot()可以画出一个曲线图,请看下面的例子:
x = np.linspace(0,10,100)
y = np.cos(x)
plt.plot(x,y)
结果如下图所示: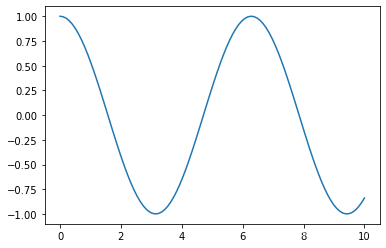
(1)更改颜色
我们可以更改曲线的颜色:
plt.plot(x,y,'k') # 黑色曲线
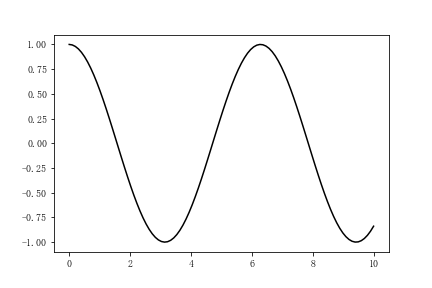
其他的颜色有以下四种常用的模式:
a.使用颜色的英文名或简写
可以直接使用常见颜色的英文名或者简写来表示这个颜色,和上一个实例类似,下面列举出一些常见的颜色表:
| 颜色 | 标志 | 颜色 | 标志 |
|---|---|---|---|
| 蓝色 | ‘b’ | 黄色 | ‘y’ |
| 绿色 | ‘g’ | 黑色 | ‘k’ |
| 红色 | ‘r’ | 白色 | ‘w’ |
| 青色 | ‘c’ | 洋红色 | ‘m’ |
b.RGB/RGBA模式
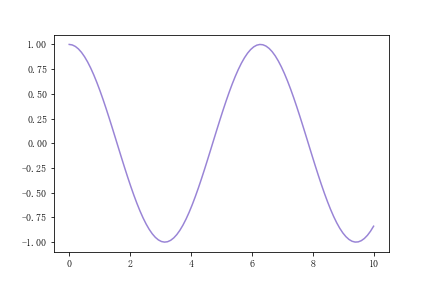
使用一个元组输入(R,G,B)或者(R,G,B,A)分别代表red,green,blue和alpha(透明度),请看下面的例子:
x = np.linspace(0,10,100)
y = np.cos(x)
plt.plot(x,y,c = (0.5,0.4,0.8,0.8))
c.十六进制RGB字符串
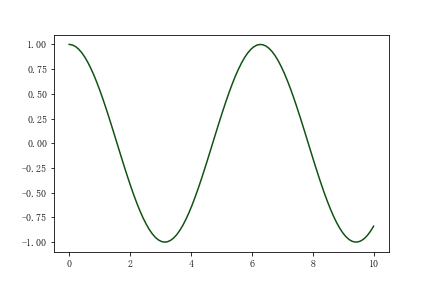
由十六进制编码组成的RGB字符串可以代替一个颜色,请看下面的例子:
x = np.linspace(0,10,100)
y = np.cos(x)
plt.plot(x,y,c = '#0f5212')
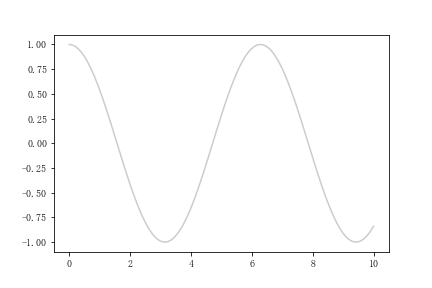
d.使用0-1之间的灰度值
可以使用0-1之间的值来表示灰度,0表示纯黑色,1表示纯白色,0.5表示灰色,请看下面的例子:
x = np.linspace(0,10,100)
y = np.cos(x)
plt.plot(x,y,c= '0.8')
(2)设置线型
我们可以设置线条的形状:
plt.plot(x,y,'g--') # 绘制绿色且为虚线的线条图
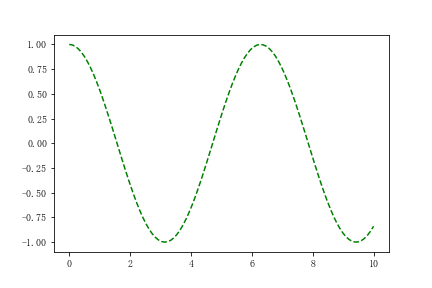
还有其他种类的线条形状如下表所示:
| 线条 | 标志 |
|---|---|
| 实线 | ‘-’ |
| 虚线 | ‘–’ |
| 点 | ‘:’ |
| 点虚线 | ‘-.’ |
除了这些常用的线型,我们还可以自己定义线型,具体方法如下:
使用一个元组,元组中包含一个元素和一个元组,元素表示偏置,一般为0,元组表示它的线型,举个例子可以很容易理解这一点:
x = np.linspace(0,10,100)
y = x
plt.plot(x,y,linestyle = (0,(1,2,5,1)))
这表示1像素的线,接2像素的空格,接5像素的线,接1像素的线以此类推: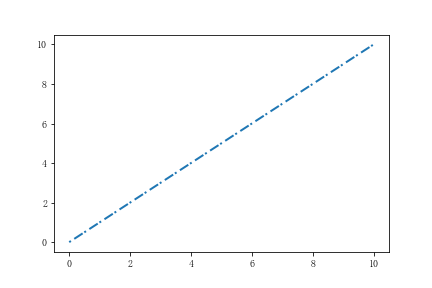
我们还可以对线条的粗细进行调整:
x = np.linspace(0,10,100)
y = x
plt.plot(x,y,linestyle = (0,(1,2,5,1)),linewidth = 4)
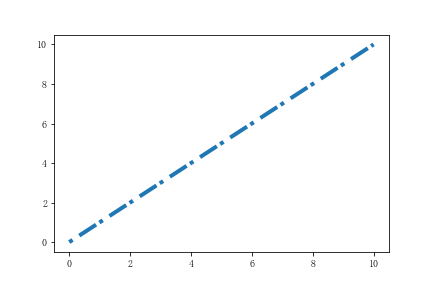
我们还可以对数据进行描点:
x = np.linspace(0,10,10)
y = x
plt.plot(x,y,marker = 'o')
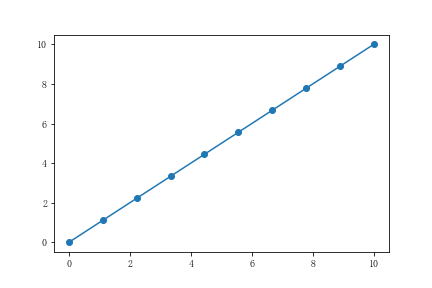
还有其他的一些标记符号可以参考下面的表格:
| 符号 | 标志 | 符号 | 标志 |
|---|---|---|---|
| 点 | ‘.’ | 逗号 | ‘,’ |
| 上箭头 | ‘^’ | 下箭头 | ‘v’ |
| 左箭头 | ‘<’ | 右箭头 | ‘>’ |
| 四边形 | ‘s’ | 五边形 | ‘p’ |
| 星形 | ‘*’ | 加号形 | ‘+’ |
| 乘号形 | ‘x’ | 乘号填充形 | ‘X’ |
| 钻石形 | ‘D’ | 细钻石形 | ‘d’ |
| 小竖线形 | ‘|’ | 小横线形 | ‘_’ |
我们可以使用如下的选项来对marker进行修改:
markeredgecolor或者mec:边缘颜色
markeredgewidth或者mew:边缘宽度
markerfacecolor或者mfc:表面颜色*
markersize或者ms:标签大小
这里不做过多演示,大致与之前演示的设置方法一致。
(2) s c a t t e r ( ) scatter() scatter():散点图
s c a t t e r ( ) scatter() scatter()可以画出散点图,请看下面的例子:
x = np.random.randint(0,10,size = 10)
y = np.random.randint(0,10,size = 10)
plt.scatter(x,y)
结果如下图所示: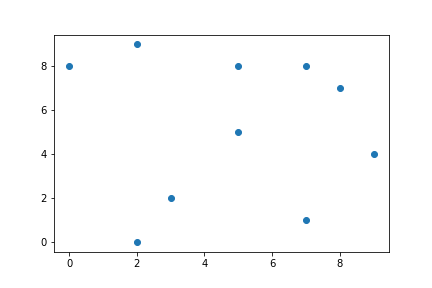
我们也可以设置它的颜色,标记点的类型,这与上一部分一致。
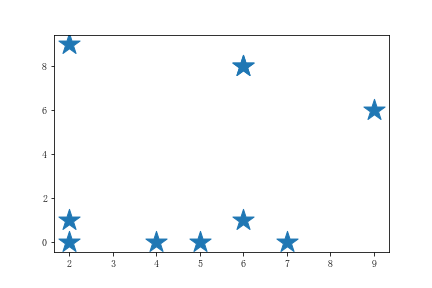
我们可以通过设置s参数改变它的标记大小:
x = np.random.randint(0,10,size = 10)
y = np.random.randint(0,10,size = 10)
plt.scatter(x,y,s = 500,marker = '*')
(3) b a r ( ) / b a r h ( ) bar()/barh() bar()/barh():条形图
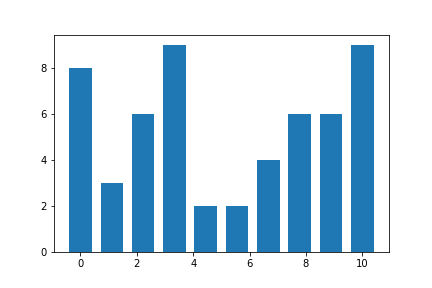
b a r ( ) bar() bar()可以画出以x轴为自变量的条形图:
x = np.linspace(0,10,10)
y = np.random.randint(1,10,size = 10)
plt.bar(x,y)
b a r h ( ) barh() barh()则可以画出以y轴为自变量的条形图:
x = np.linspace(0,10,10)
y = np.random.randint(1,10,size = 10)
plt.barh(x,y)
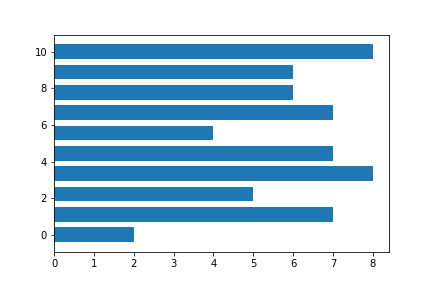
我们可以设置条形图的宽度:
x = np.linspace(0,10,10)
y = np.random.randint(1,10,size = 10)
plt.bar(x,y,width=0.2)
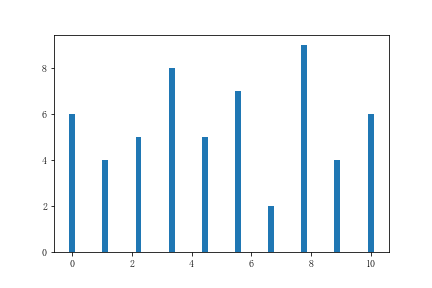
还可以设置y轴最底部的起始值:
x = np.linspace(0,10,10)
y = np.random.randint(1,10,size = 10)
plt.bar(x,y,bottom=2)
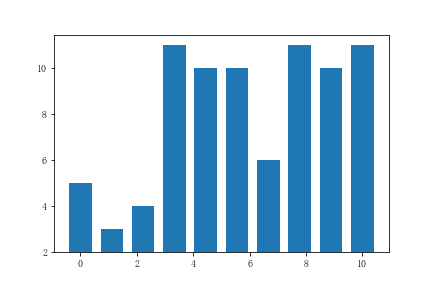
还可以设置条在x轴的对齐方式:
x = np.linspace(0,10,10)
y = np.random.randint(1,10,size = 10)
plt.bar(x,y,align='edge') # 默认为居中
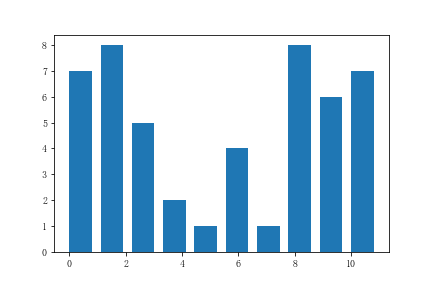
(4) p i e ( ) pie() pie():饼图
x = [1,2,3,4]
plt.pie(x)

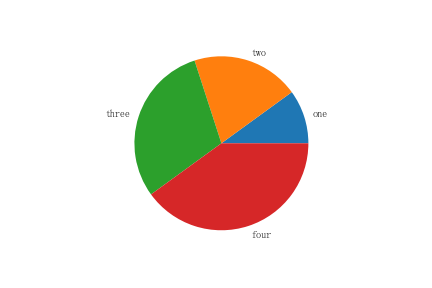
除了可以改变它的颜色,还可以为饼图添加标签:
x = [1,2,3,4]
plt.pie(x,labels=['one','two','three','four'])
可以设置它的半径:
fig = plt.figure()
x = [1,2,3,4]
plt.pie(x,radius=0.5)

(5) s t e m ( ) stem() stem():茎图
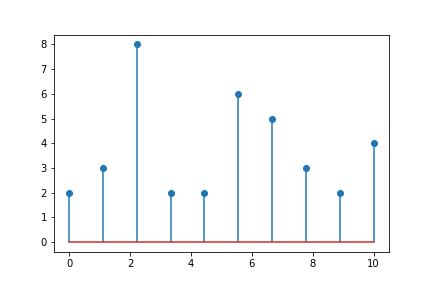
s t e m ( ) stem() stem()可以画出树干图:
x = np.linspace(0,10,10)
y = np.random.randint(1,10,size = 10)
plt.stem(x,y)
(6) s t e p ( ) step() step():阶梯图
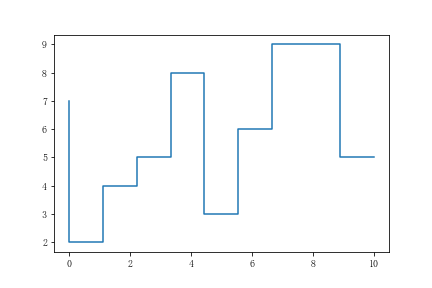
s t e p ( ) step() step()可以画出阶梯图:
x = np.linspace(0,10,10)
y = np.random.randint(1,10,size = 10)
plt.step(x,y)
除了一些基本的对线条的修改,它还可以与 p l o t ( ) plot() plot()配合使用设置它的数据位置,请看下面的例子:
x = np.arange(14)
y = np.sin(x / 2)

plt.step(x, y + 2, label='pre (default)')
plt.plot(x, y + 2, 'o--', color='grey', alpha=0.3)

plt.step(x, y + 1, where='mid', label='mid')
plt.plot(x, y + 1, 'o--', color='grey', alpha=0.3)

plt.step(x, y, where='post', label='post')
plt.plot(x, y, 'o--', color='grey', alpha=0.3)
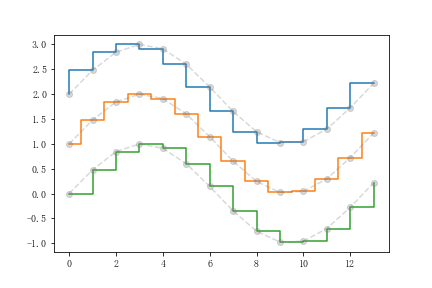
可以看到,在画出的阶梯图中,描点所在的位置位于阶梯的内部、中部和外部。
(7) h i s t ( ) hist() hist():直方图
h i s t ( ) hist() hist()用来绘制直方图
plt.figure()
r = np.random.normal(0,2,200)
x = 5+r
plt.hist(x)
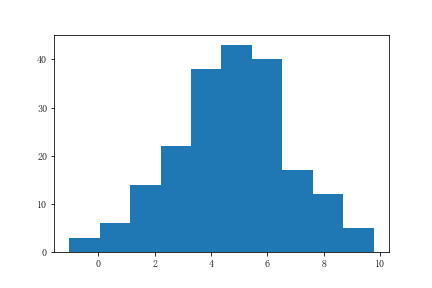
我们可以确定将数据分为几个条柱进行显示,如果传入的是一个正数,那么它将均匀分配,你也可以选择传入一个序列,那么它将根据你传入的序列进行分配:
r = np.random.normal(0,2,200)
x = 5+r
plt.hist(x,bins=5) # 将数据放在五等分的直方图中
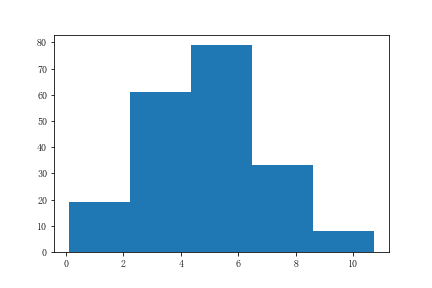
我们也可以确定条柱取值的范围:
r = np.random.normal(0,2,200)
x = 5+r
plt.hist(x,range=[0,20]) #
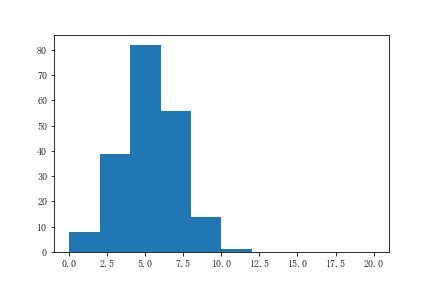
(8) f i l l _ b e t w e e n ( ) fill\_between() fill_between():两侧填充图
f i l l _ b e t w e e n ( ) fill\_between() fill_between()可以画出两侧填充图:
x = np.linspace(0,10,10)
r = np.random.randint(1,5,size=10)
y1 = np.add(x,r)
y2 = np.add(x,-r)
plt.plot(x,x)
plt.fill_between(x,y1,y2,alpha = 0.5) # alpha设置透明度
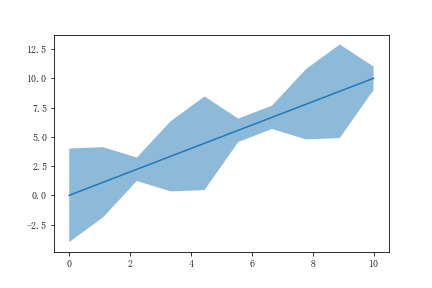
注意: 以下的几种绘图可能不是很常用
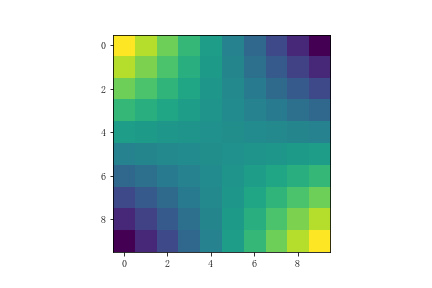
(9) i m s h o w ( ) imshow() imshow():像素图
i m s h o w ( ) imshow() imshow()可以生成像素图
x, y = np.meshgrid(np.linspace(-3,3,10),np.linspace(-3,3,10))
z = x*y
plt.imshow(z)
(10) p c o l o r m e s h ( ) pcolormesh() pcolormesh():非规范像素图
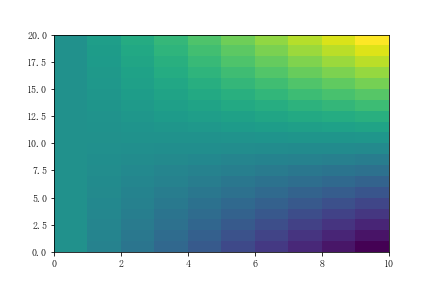
p c o l o r m e s h ( ) pcolormesh() pcolormesh()可以生成非规范像素图,它和像素图的区别是:它的像素并不是一个正方形,而可以是矩形:
x, y = np.meshgrid(np.linspace(0,3,10),np.linspace(-3,3,15))
z = y * x
plt.pcolormesh(z)
(11) c o n t o u r ( ) contour() contour()和 c o n t o u r f ( ) contourf() contourf():等高线图
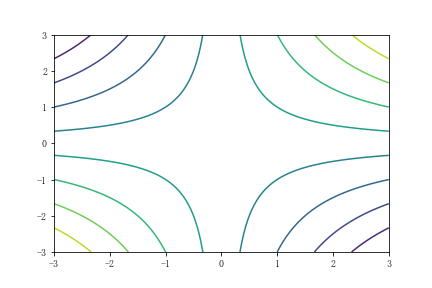
c o n t o u r ( ) contour() contour()和 c o n t o u r f ( ) contourf() contourf()可以绘制等高线图
x, y = np.meshgrid(np.linspace(-3,3,200),np.linspace(-3,3,200))
z = x**1/2 * y
level = np.linspace(z.min(),z.max(),10)
plt.contour(x,y,z,level)
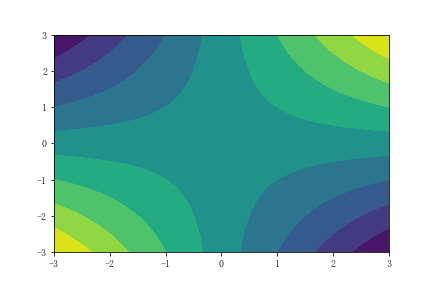
而 c o n t o u r f ( ) contourf() contourf()则是带有填充的等高线图
x, y = np.meshgrid(np.linspace(-3,3,200),np.linspace(-3,3,200))
z = x**1/2 * y
level = np.linspace(z.min(),z.max(),10)
plt.contourf(x,y,z,level)
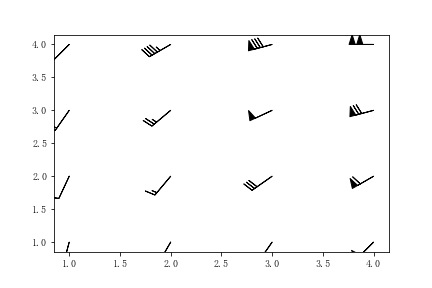
(12) b a r b s ( ) barbs() barbs():风杆图
b a r b s ( ) barbs() barbs()用来绘制风杆图
X, Y = np.meshgrid([1, 2, 3, 4], [1, 2, 3, 4])
angle = np.pi / 180 * np.array([[15., 30, 35, 45],
                                [25., 40, 55, 60],
                                [35., 50, 65, 75],
                                [45., 60, 75, 90]]) # 构造角度
amplitude = np.array([[5, 10, 25, 50],
                      [10, 15, 30, 60],
                      [15, 26, 50, 70],
                      [20, 45, 80, 100]]) # 构造速度
U = amplitude * np.sin(angle) # 构造矢量
V = amplitude * np.cos(angle)
这里简单介绍一下风杆图的看法:
在像一个小旗的杆上,一个短线表示5海里/小时,一个长线表示10海里/小时,一个黑色的三角形表示50海里/小时,风杆所指的方向为方向,也就是风从哪个方向吹来。比如下图中右上角风杆的表示:从西方向吹来的风,速度为100海里/小时。
(13) q u i v e r ( ) quiver() quiver():矢量图
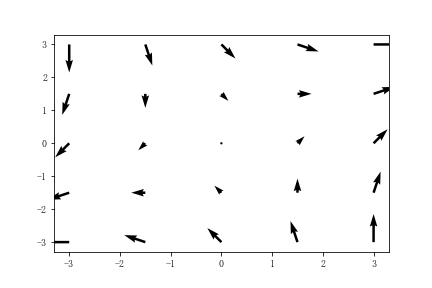
q u i v e r ( ) quiver() quiver()可以绘制带箭头的矢量图
x, y = np.meshgrid(np.linspace(-3,3,5),np.linspace(-3,3,5))
u = x + y # 箭头矢量在x和y方向的分量
v = x - y
plt.quiver(x,y,u,v)
(14) s t r e a m p l o t ( ) streamplot() streamplot():气流图
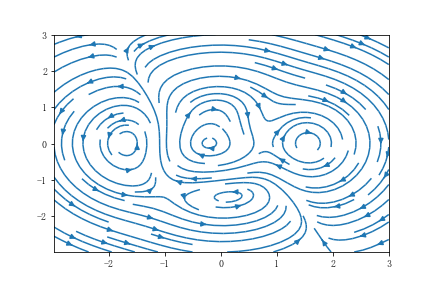
s t r e a m p l o t ( ) streamplot() streamplot()用来绘制气流图
X, Y = np.meshgrid(np.linspace(-3, 3, 256), np.linspace(-3, 3, 256))
Z = (1 - X/2 + X**5 + Y**3) * np.exp(-X**2 - Y**2)
V = np.diff(Z[1:, :], axis=1)
U = -np.diff(Z[:, 1:], axis=0)
plt.streamplot(X[1:, 1:], Y[1:, 1:], U, V)
(15) b o x p l o t ( ) boxplot() boxplot():箱线图
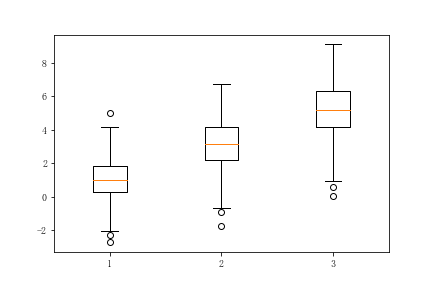
plt.figure()
x = np.random.normal((1,3,5),(1.25,1.5,1.75),(200,3))
plt.boxplot(x)
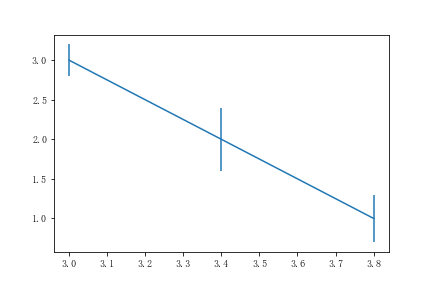
(16) e r r o r b a r errorbar errorbar:误差栏图
x = [3,3.4,3.8]
y = [3,2,1]
error = [0.2,0.4,0.3]
plt.errorbar(x,y,error)
(17) v i o l i n p l o t ( ) violinplot() violinplot():小提琴图
x = np.random.normal((1,3,5),(1.25,1.5,1.75),(200,3))
plt.violinplot(x)
(18) h i s t 2 d ( ) hist2d() hist2d():二维直方图
x = np.random.randn(1000)
y = np.random.randn(1000)
plt.hist2d(x,y)
(19) h e x b i n ( ) hexbin() hexbin():六边形直方图
x = np.random.randn(100)
y = np.random.randn(100)
plt.hexbin(x,y,gridsize=10)
(20) t r i c o n t o u r ( ) tricontour() tricontour()和 t r i c o n t o u r f ( ) tricontourf() tricontourf():非等距等高图
x = np.random.uniform(-3, 3, 200)
y = np.random.uniform(-3, 3, 200)
z = (1 - x/2 + x**2 + y**2) * np.exp(-x**2 - y**2)
levels = np.linspace(z.min(), z.max(), 7)
plt.tricontour(x,y,z,levels)
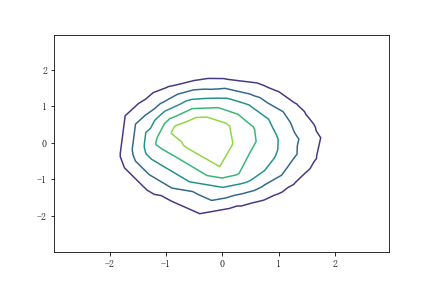
t r i c o n t o u r f ( ) tricontourf() tricontourf()是带有填充的等高图
x = np.random.uniform(-3, 3, 200)
y = np.random.uniform(-3, 3, 200)
z = (1 - x/2 + x**2 + y**2) * np.exp(-x**2 - y**2)
levels = np.linspace(z.min(), z.max(), 7)
plt.tricontourf(x,y,z,levels)
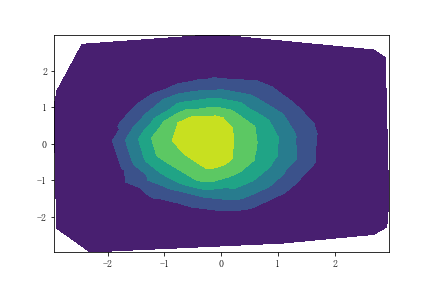
(21) t r i p c o l o r ( ) tripcolor() tripcolor():三角形彩图
x = np.random.uniform(-3, 3, 200)
y = np.random.uniform(-3, 3, 200)
z = (1 - x/2 + x**2 + y**2) * np.exp(-x**2 - y**2)
levels = np.linspace(z.min(), z.max(), 7)
plt.tripcolor(x,y,z,levels)
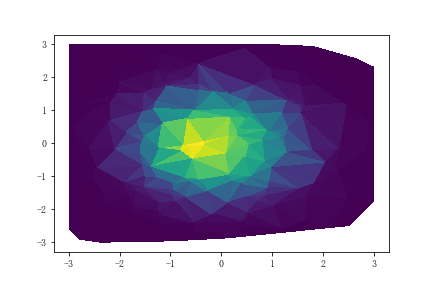
(22) t r i p l o t ( ) triplot() triplot():二维三角图
x = np.random.uniform(-3, 3, 200)
y = np.random.uniform(-3, 3, 200)
plt.triplot(x,y)
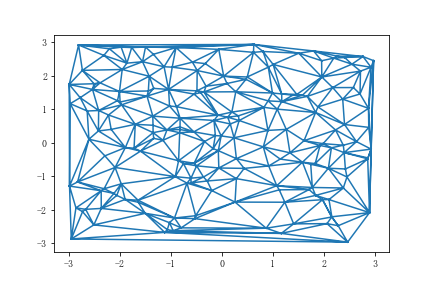
2.常用的绘图选项
(1)添加标题
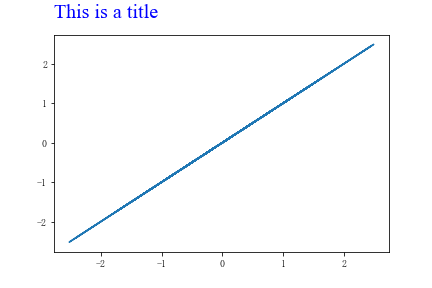
可以为绘制好的图像添加标题,我们可以使用fontdict对标题样式进行修改,还可以调整标题的位置(默认为居中),还可以调整标题和图像之间的距离:
x = np.random.randn(100)
y = x
plt.plot(x,y)
plt.title('This is a title',
          fontdict=
          {
    'family':'Times New Roman', # 字体
           'fontsize': 'xx-large', # 字号
           'color': 'b' # 字体颜色
          },
          loc = 'left', # 居左
          y=1.2 # 标题和图像的距离
         )
(2)添加轴标签
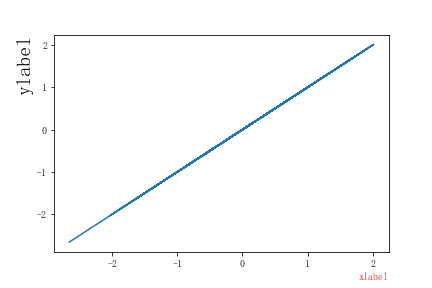
可以为图像添加x和y轴的label:
x = np.random.randn(100)
y = x
plt.plot(x,y)
plt.xlabel('xlabel',loc='right',c = 'r') # 靠右的红色xlabel
plt.ylabel('ylabel',loc='top',fontsize = 20) # 靠上的20号字号的ylabel
(3)添加图例
我们可以在多个曲线的同一图中添加标签,以便区分曲线:
x = np.linspace(0,10,100)
y = x
z = x**2
plt.plot(x,y,x,z)
plt.legend(['$x$','$x^2$']) # 设置标签可以使用Latex语法
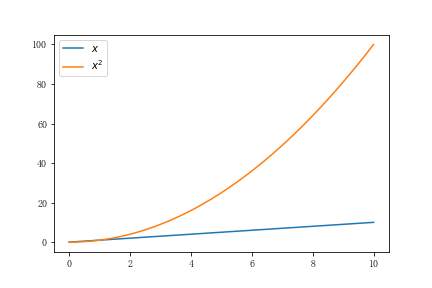
当然你也可以设置它的位置,字体颜色,大小等参数,这与前面提到的相关设置方法是一致的。
(4)添加网格
我们可以设置图像显示网格,或者可以设置只显示某一个轴上的网格:
x = np.linspace(0,10,100)
y = x
plt.plot(x,y)
plt.grid(axis='x',c = 'r',linestyle = '-.')
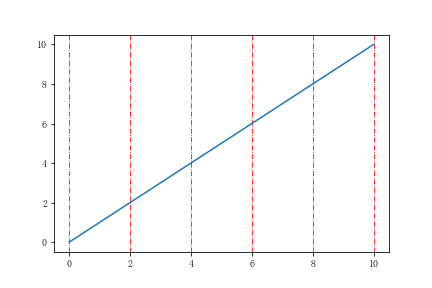
可以看到也可以设置网格的颜色和线型等参数
(5)添加文本
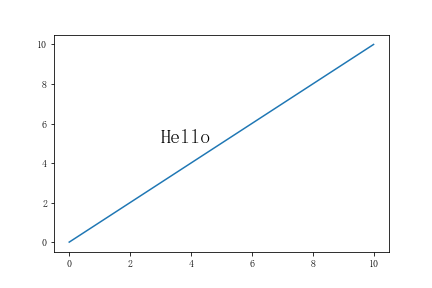
可以在图像中添加文字说明:
x = np.linspace(0,10,100)
y = x
plt.plot(x,y)
plt.text(3,5,'Hello',fontsize = 20)
(6)设置x和y轴范围
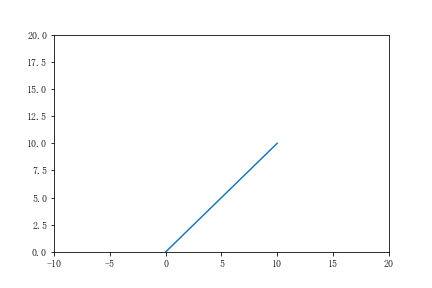
可以自己设定x轴和y轴的范围,以便达到想要的视觉效果:
x = np.linspace(0,10,100)
y = x
plt.plot(x,y)
plt.xlim(-10,20)
plt.ylim(0,20)
(7)设置x轴和y轴的刻度
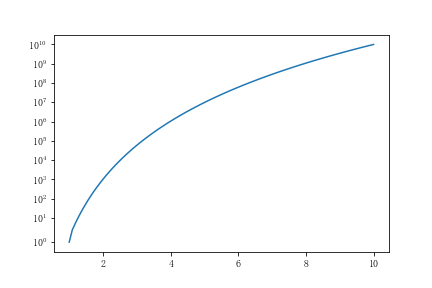
有些时候我们需要的刻度并不一定是线性的,可能在对数下有更好的表现,
x = np.linspace(1,10,100)
y = x**10
plt.plot(x,y)
plt.yscale('symlog') # 使用科学计数法
除此之外还有对数型,分对数型
(8)设置x轴和y轴的标签
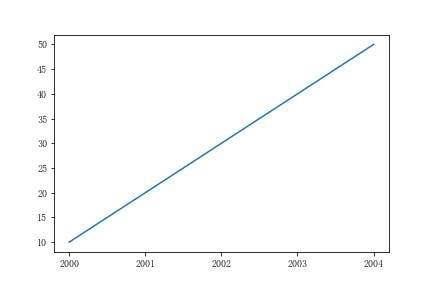
我们可以为x或y轴的数据赋予特殊的含义,比如:年份等:
x = np.linspace(1,5,10)
y = x*10
plt.plot(x,y)
plt.xticks(ticks = [1,2,3,4,5],
           labels=['2000','2001','2002','2003','2004'])
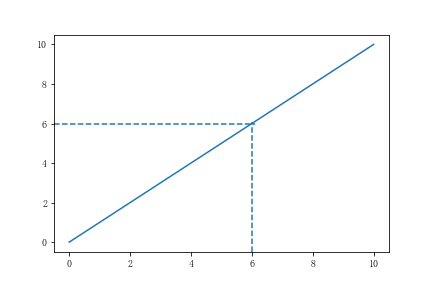
(9)添加辅助对齐线
x = np.linspace(0,10,100)
y = x
plt.plot(x,y)
plt.axhline(6,0,0.6,linestyle = '--') # 在6处画线,从0到60%处
plt.axvline(6,0,0.6,linestyle = '--')
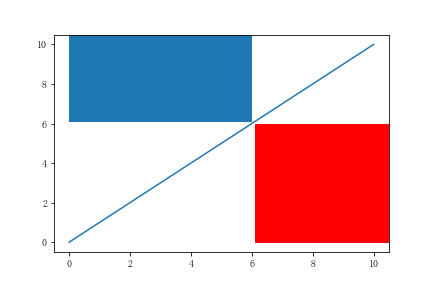
(10)添加跨度矩形
x = np.linspace(0,10,100)
y = x
plt.plot(x,y)
plt.axhspan(6,0,0.6,color = 'r')
plt.axvspan(6,0,0.6)
二、面向对象绘图
基于面向对象的绘图是Matplotlib的一大特色,它将一个图分为图窗对象和轴对象,进行操作时几乎不会产生模糊的意义。
1.创建figure和axes对象
使用 s u b p l o t s ( ) subplots() subplots()可以创建一个figure对象和axes对象:
fig, ax = plt.subplots()
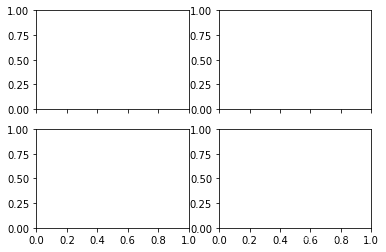
实际上我们可以在创建时,设定一些它的参数,比如,我们可以设置为多个轴,即传入有几行几列,并设置它们的坐标是否相互共享:
fig, ax = plt.subplots(2,2,sharex=True,sharey=False)
2.绘图
我们可以在官方文档得知figure和axes实际的含义:
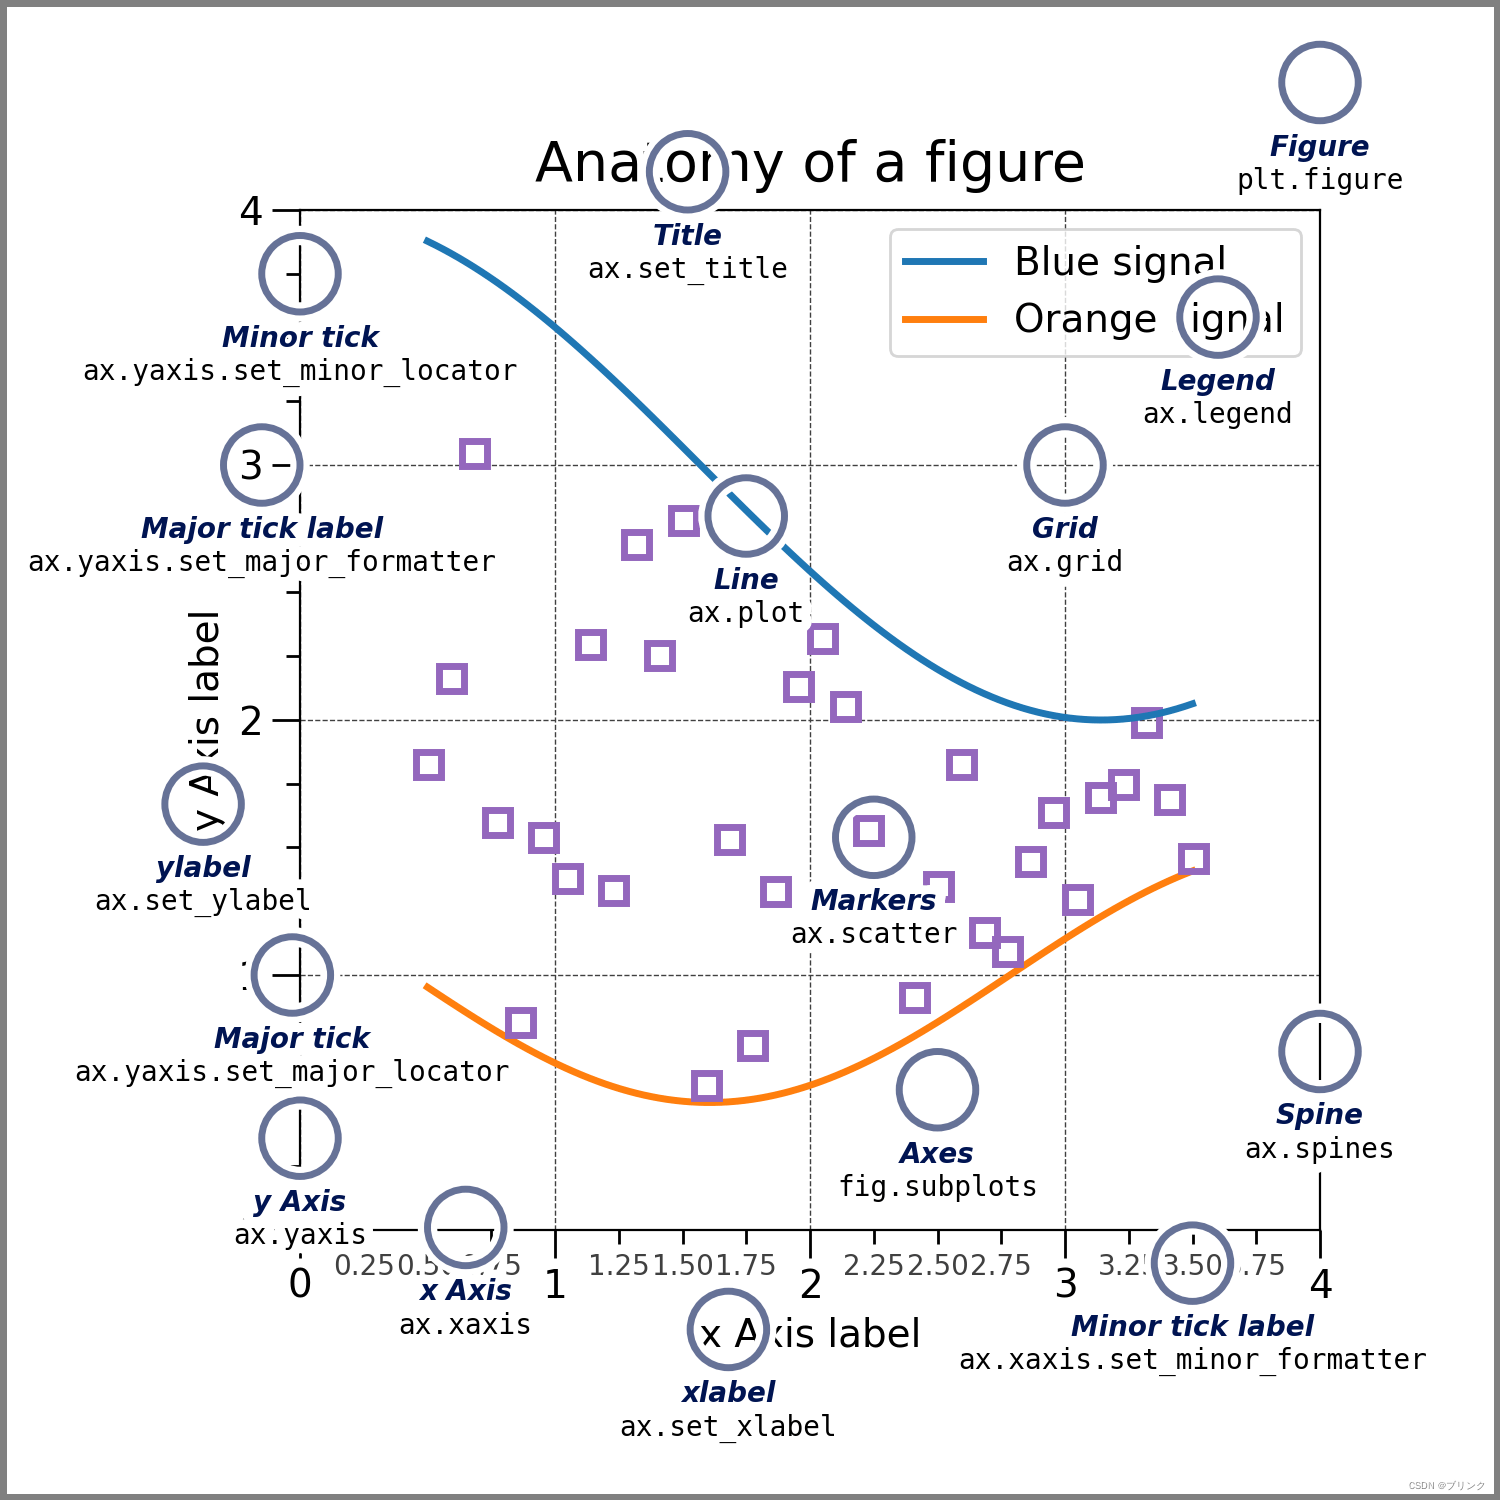
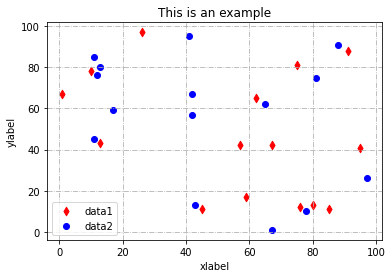
可以看到,figure实际上就是画布,而axes是由坐标轴构成的图形的部分。图片上也列出了使用这种方法进行绘图的方法。有了之前通过面向过程绘图的基础,只需要将其迁移到面向对象绘图上即可。下面举个例子:
x = np.random.randint(0,100,15)
y = np.random.randint(0,100,15) # 制造一些数据

fig,ax = plt.subplots()
ax.scatter(x,y,c='r',label='data1','d') # 画散点图
ax.scatter(y,x,c='b',label='data2')
ax.set_title('This is an example') # 设置标题
ax.set_xlabel('xlabel') # 设置xlabel
ax.set_ylabel('ylabel')
ax.grid('-.') # 开启网格
ax.legend() # 开启图例
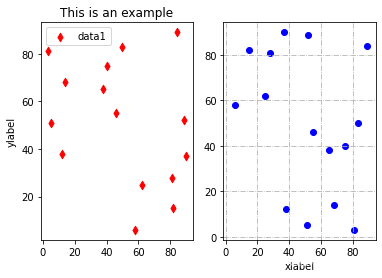
当我们在一个图窗中有多个轴时,面向对象的绘图方式就体现出了它的优势,请看下面的例子:
x = np.random.randint(0,100,15)
y = np.random.randint(0,100,15)
fig, (ax1,ax2) = plt.subplots(1,2,sharex=True,sharey=False)
ax1.scatter(x,y,c='r',label='data1',marker='d')
ax2.scatter(y,x,c='b',label='data2')
ax1.set_title('This is an example')
ax2.set_xlabel('xlabel')
ax1.set_ylabel('ylabel')
ax2.grid(linestyle='-.')
ax1.legend()
三、风格美化
在撰写论文时,插图风格的统一有助于增加文章的美观性,Matplotlib下style包提供了设置统一风格的选项。
首先导入包:
from matplotlib import style
我们可以先查看一下有哪些可以使用的风格,使用
>>> style.available
['Solarize_Light2',
 '_classic_test_patch',
 '_mpl-gallery',
 '_mpl-gallery-nogrid',
 'bmh',
 'classic',
 'dark_background',
 'fast',
 'fivethirtyeight',
 'ggplot',
 'grayscale',
 'seaborn',
 'seaborn-bright',
 'seaborn-colorblind',
 'seaborn-dark',
 'seaborn-dark-palette',
 'seaborn-darkgrid',
 'seaborn-deep',
 'seaborn-muted',
 'seaborn-notebook',
 'seaborn-paper',
 'seaborn-pastel',
 'seaborn-poster',
 'seaborn-talk',
 'seaborn-ticks',
 'seaborn-white',
 'seaborn-whitegrid',
 'tableau-colorblind10']
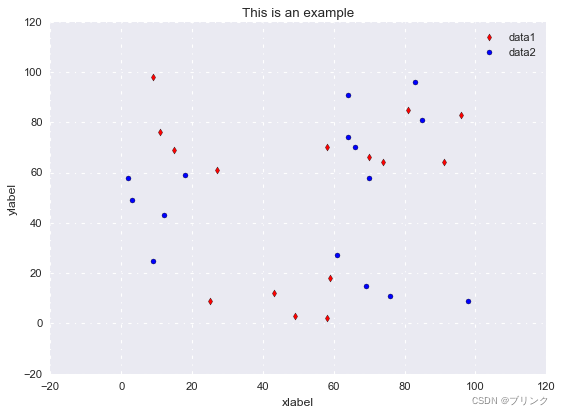
此时,我们可以使用设置全局风格
style.use('seaborn') # seaborn是一个基于Matplotlib的绘图库
即可
边栏推荐
- 内网渗透之内网信息收集(三)
- Network technology related topics
- Bing Dwen Dwen official NFT blind box will be sold for about 626 yuan each; JD home programmer was sentenced for deleting the library and running away; Laravel 9 officially released | Sifu weekly
- The difference between layer 3 switch and router
- Hackmyvm target series (2) -warrior
- xray與burp聯動 挖掘
- 移植蜂鸟E203内核至达芬奇pro35T【集创芯来RISC-V杯】(一)
- “人生若只如初见”——RISC-V
- 搭建域环境(win)
- Library management system
猜你喜欢
Statistics 8th Edition Jia Junping Chapter 12 summary of knowledge points of multiple linear regression and answers to exercises after class

Attack and defense world misc practice area (GIF lift table ext3)

Statistics 8th Edition Jia Junping Chapter IX summary of knowledge points of classified data analysis and answers to exercises after class
Build domain environment (win)
Network technology related topics

浅谈漏洞发现思路

JVM memory model concept
Interview Essentials: what is the mysterious framework asking?

Wei Shen of Peking University revealed the current situation: his class is not very good, and there are only 5 or 6 middle-term students left after leaving class

Statistics 8th Edition Jia Junping Chapter 14 summary of index knowledge points and answers to exercises after class
随机推荐
2022华中杯数学建模思路
Statistics 8th Edition Jia Junping Chapter XIII Summary of knowledge points of time series analysis and prediction and answers to exercises after class
. Net6: develop modern 3D industrial software based on WPF (2)
Mysql的事务是什么?什么是脏读,什么是幻读?不可重复读?
Statistics 8th Edition Jia Junping Chapter IX summary of knowledge points of classified data analysis and answers to exercises after class
《统计学》第八版贾俊平第二章课后习题及答案总结
Feature extraction and detection 14 plane object recognition
函数:求1-1/2+1/3-1/4+1/5-1/6+1/7-…+1/n
List and data frame of R language experiment III
New version of postman flows [introductory teaching chapter 01 send request]
使用 flask_whooshalchemyplus jieba实现flask的全局搜索
网络基础之路由详解
Hackmyvm target series (5) -warez
Fire! One day transferred to go engineer, not fire handstand sing Conquest (in serial)
网络层—简单的arp断网
攻防世界MISC练习区(gif 掀桌子 ext3 )
《統計學》第八版賈俊平第七章知識點總結及課後習題答案
Résumé des points de connaissance et des réponses aux exercices après la classe du chapitre 7 de Jia junping dans la huitième édition des statistiques
The United States has repeatedly revealed that the yield of interest rate hiked treasury bonds continued to rise
Statistics 8th Edition Jia Junping Chapter 7 Summary of knowledge points and answers to exercises after class